A key uncertainty around the long-run impact of the Budget's plans for higher public investment is the extent to which the public capital stock is a complement to (or substitute for) business investment. This Box provided scenarios in which the future business capital stock was higher or lower than we had assumed in our central forecast. We showed these scenarios' impacts on potential output in 50 years' time and the implications they had for different measures of the internal rate of return on investment.
This box is based on OBR data from October 2024 .
In modelling the long-run impact of higher public investment spending on potential output in our central forecast, we used the analytical framework set out in our recent Discussion Paper.a A key area of uncertainty is the extent to which public investment is, on average, a complement or substitute for business investment. Empirical evidence on the impact of higher public investment on business investment is mixed. For a £1 increase in public investment, the estimates from a range of studies suggest that the impact on business investment could vary from a reduction of £0.30 (so public and private capital are substitutes) to an increase of £2 (so public and private capital are strong complements).b The different findings partially reflect different methodologies and samples in the literature. But they also reflect the fact that government investment can have varying impacts on business investment depending on:
- The type of investment: some types of investment are more complementary to private capital, for example economic infrastructure spending is likely to be more complementary to business investment than public sector house building.
- Source of financing: financing public investment through higher borrowing or taxes could reduce private investment by, respectively, raising economy-wide interest rates or reducing the post-tax return on investment for businesses.
- Extent of de-risking: public investment can reduce uncertainty and risk for private investors in early-stage technologies, encouraging them to enter the market and so increasing business investment.
- Competition for resources: public and private investment may be competing for the same labour and other inputs, raising their prices. This could reduce total investment below the level desired by the public and private sector when there is little or no slack in the economy, though over the long term the economy is likely to adjust.
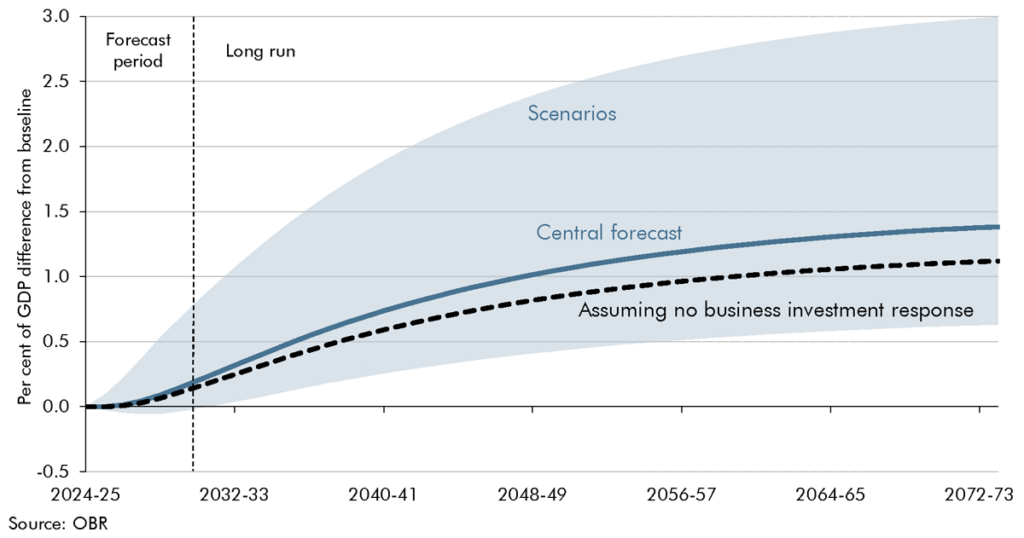
The following alternative scenarios illustrate these upside and downside risks to GDP from the increase in capital spending announced in this Budget, assuming that higher government investment persists beyond the five-year forecast horizon (Chart B):
- In the upside scenario, public and private capital are strong complements so every additional £1 of public investment increases business investment by £2 (rather than around £0.30 as in the central forecast). In this scenario, the increase in public investment leaves GDP 3.0 per cent higher at the 50-year horizon than it would otherwise be (rather than 1.4 per cent higher as in our central forecast). The 1.6 percentage point difference reflects a higher stock of private capital.
- In the downside scenario, public and private capital are substitutes so every additional £1 of public investment reduces business investment by £0.50. The greater lags assumed around public investment spending mean its direct effect on GDP is more than offset by lower business investment at the five-year horizon. In this scenario, the increase in public investment leaves GDP only 0.6 per cent higher in 50 years (the minus 0.8 percentage point difference from the central forecast entirely reflects a smaller private capital stock).
Chart B: Impact of higher public investment: different scenarios

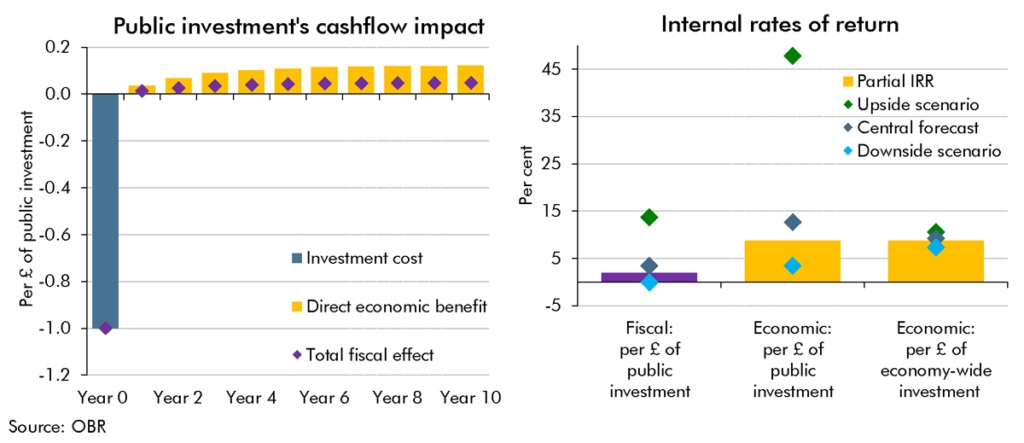
As the left-hand panel of Chart C shows, our assumptions mean that public investment has upfront costs today, but produces benefits in the future (defined as the extra GDP or tax receipts it creates). As shown on the right-hand panel, these assumptions mean that the real economic internal rate of return (IRR) of public investment projects, measured in terms of the GDP produced per pound of upfront cost, is around 9 per cent.c The Treasury only captures some of this extra GDP in tax receipts, so the fiscal return to the public finances is smaller, at around 2 per cent.
As in our Discussion Paper, these are ‘partial’ rates of return that focus on the extra GDP and tax receipts directly produced by a larger public capital stock. Including the additional GDP or taxes produced by the extra business investment that we have incorporated in our central forecast raises them somewhat: to 13 or 3 per cent of GDP. These figures calculate the return to an extra pound of public investment in terms of higher GDP or taxes including both the direct impact of the public capital itself plus the extra impact from the induced boost to business capital. It attributes that joint impact to the public investment. In effect this does not count as a cost to the government the resources used in the extra business investment, so it is best seen as a ‘bang for the buck’ measure of public capital spending. They rise significantly further in our upside scenario and fall in our downside scenario. Impacts on the rate of return per pound of economy-wide investment (which incorporate the additional costs of more private sector investment) are closer to the partial rates of return.
Chart C: Rates of return on public investment

This box was originally published in Economic and fiscal outlook – October 2024
