
The likely rate of productivity growth is one of the most important judgements in our economic and fiscal forecasts. Alongside this EFO, we have published Briefing paper No. 9: Forecasting productivity, which sets out our latest view of trend productivity growth. This box set out key findings from the paper and scenarios for future productivity growth.
This box is based on EUKLEMS and INTANTProd and ONS data from January 2025, May 2025, and September 2025 .
The likely rate of productivity growth is one of the most important judgements in our economic and fiscal forecasts. Alongside this EFO, we have published Briefing paper No.9: Forecasting productivity, which sets out our latest view of trend productivity growth. This box sets out key findings from the paper and scenarios for future productivity growth.
We have revised down our central estimate of underlying medium-term productivity growth from 1.3 per cent to 1.0 per cent in this forecast. This judgement is based on assessments of:
- the UK’s productivity performance over long periods, alongside comparisons with other major advanced economies;
- what successive vintages of official output and labour force data imply about underlying productivity and the impact of economic shocks in recent years; and
- structural changes affecting the UK’s past and future productive potential, including developments in global trade policy, shifts in the composition of output, and underlying
trends including the rise of artificial intelligence (AI).
Historically, there have been points when the trajectory of productivity growth changes across eras, while sudden rises or falls are typically followed by some reversion to that era’s trajectory. It is easier to identify these eras looking backward than to characterise current or future growth.
UK productivity growth has clearly been much lower since 2008. Annual productivity growth, defined as real GDP growth per hour worked for the whole economy, averaged 2.1 per cent between 1998 and 2007, 0.6 per cent from 2010 to 2019, and 0.4 per cent from 2020 to 2024. The productivity slowdown has been global, but the UK has seen the largest fall in the G7 (Chart A, left panel). We have previously made downward revisions to our trend productivity forecast in response to shocks and the period of persistently weak productivity growth since 2008. The 0.3 percentage point revision we have made to medium-term productivity growth is significant, though not as large as the 0.5 percentage point revision we made in November 2017. Looking at previous forecast changes in five-year cumulative trend productivity growth, there are five other forecasts where we have made downward revisions of a similar or larger magnitude to the one in this forecast.
Chart 2A: Productivity growth averages before and after the financial crisis
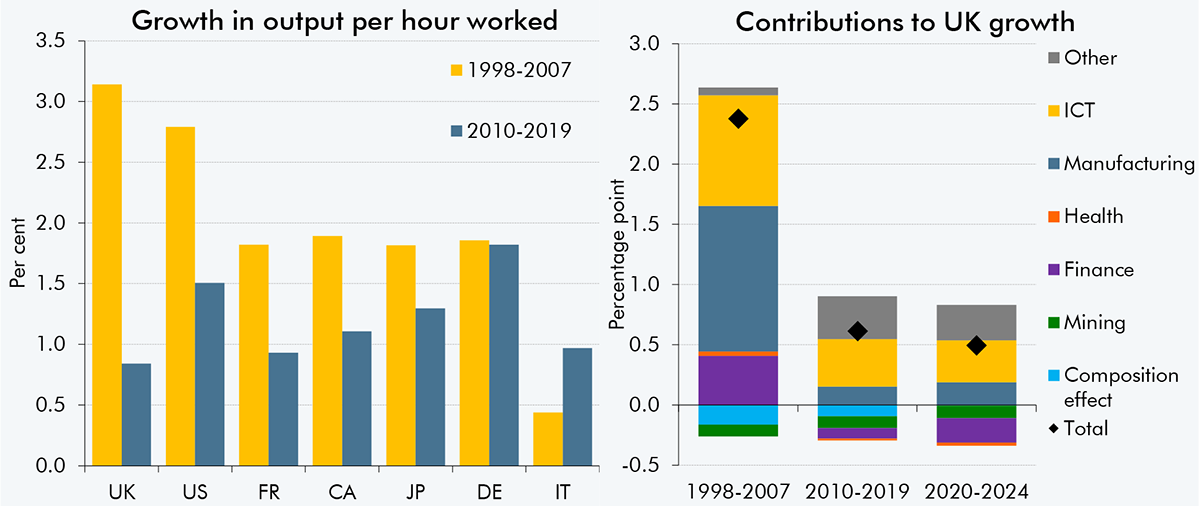
Note: The left chart uses data from EUKLEMS & INTANProd for comparability across countries. This covers market sectors excluding agriculture, except in Canada and Japan, which use the whole market sector. In the right chart, productivity is gross value added per hour worked for sectoral analysis. We chose 1998-2007 and 2010-2019 to cover a decade before and after the financial crisis.
Source: EUKLEMS & INTANProd, ONS, OBR
The latest downward revision to our central productivity growth forecast partly reflects updated ONS estimates for the path of output and hours worked. Based on earlier vintages of data, measured productivity growth after the pandemic appeared to be rising toward our previous medium-term trend assumption that TFP growth would return to halfway between its pre- and post-financial crisis averages. But the productivity picture has become somewhat clearer, though not stronger, more recently. According to Labour Force Survey (LFS)-based ONS data, average annual growth in GDP per hour worked between the second quarter of 2023 and the second quarter of 2025 averaged -0.5 per cent. Alternative productivity estimates, which account for the sample bias in the LFS by using wider labour market evidence, suggest average productivity growth over this period was positive though no stronger than in the 2010-2019 period.a
Therefore, on a range of measures productivity growth has remained tepid, several years on from the shocks of Covid and the energy crisis, and a decade-and-a-half from the financial crisis. This ongoing weakness makes it less likely that a substantial and rapid productivity growth rebound, as seen after previous shocks, will now materialise as the Covid and energy price shocks retreat into history. Rather, it suggests persistent weakness in productivity growth relative to the pre-financial crisis period is more likely to reflect underlying structural trends. In particular:
- UK and global productivity growth between the early 1990s and mid-2000s was likely boosted by rapid increases in trade as a share of GDP. UK trade intensity has stagnated since 2008, and we expect it to fall in the coming years due to the recent resurgence in global protectionism on top of the enduring effects of Brexit. This is set to weigh on productivity growth for the reasons set in in Annex C of the briefing paper.
- Sectoral factors in the UK economy are also likely to continue to drag on productivity growth (Chart A, right panel). Falling contributions from the previously more productive finance, manufacturing, and information and communications technologies (ICT) sectors since the mid-2000s are unlikely to reverse in the coming years or be offset by a rebound in productivity in other sectors. Our analysis suggests AI will likely provide a smaller boost to productivity growth over the next five years than the ICT revolution did before 2008.
- Other underlying trends should also weigh on productivity growth, including increased employment in the relatively less productive health and social work sectors as the population ages, slowing growth in the number of people entering higher education, and the negative impacts of climate change and the near-term costs of the net zero transition.
We nonetheless still expect productivity growth to rise from its recently depressed rate over the forecast. This acceleration over the medium term reflects our judgement that:
- Part of the recent weakness is from temporary factors arising from the major shocks the UK economy has experienced over the past 15 years. As the lingering effects of these fade, we continue to expect productivity growth to pick up, but less sharply than before.
- We also expect AI to begin having a positive effect on productivity growth within the forecast period. There is significant uncertainty around both the size and timing of this effect. Our central estimate is that it will build over time as adoption grows to reach an estimated 0.2 percentage points by our five-year forecast horizon. The productivity impact of AI beyond that point could be larger, as explored in Annex B of the briefing paper.
The downward revision to our medium-term productivity growth estimate takes it closer to those of other forecasters, both for the UK and peer countries. Our November 2025 forecast of 1.0 per cent medium-term productivity growth is at the top end of the range of external forecasts for the UK, where several other forecasts cluster including the Bank of England, IMF, and NIESR. It also is in the middle of the range of official forecasts for comparable countries.
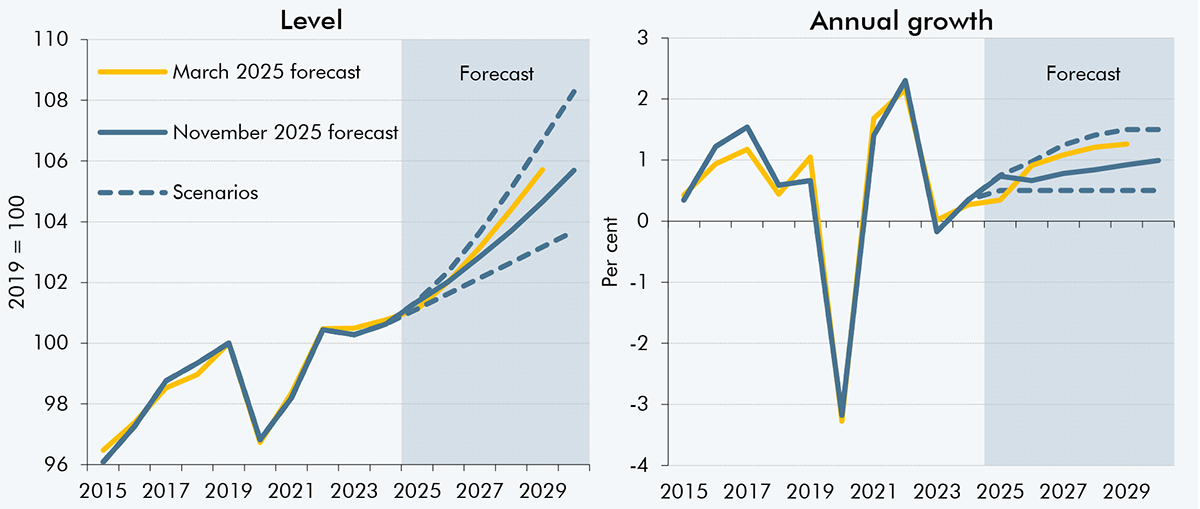
While productivity growth is one of our most impactful forecast variables for the public finances, it is also one of the most uncertain. To illustrate uncertainty around this central forecast, we present two scenarios. We explore their fiscal implications in Chapter 7.
- In our upside scenario, more of the recent weakness in productivity growth was due to temporary shocks, and there is a larger boost from AI, pushing potential productivity growth up to 1.5 per cent in the medium term.
- In the downside scenario, productivity growth stays around its post-financial crisis average of 0.5 per cent over the forecast.
Chart 2B: Trend productivity scenarios
Source: ONS, OBR
This box was originally published in Economic and fiscal outlook – November 2025