An estimate of the full cost of different energy sources to the power system needs to reflect more than just the construction and operating costs of energy generators that are captured in the levelised cost of electricity (LCOE). In this box we explored enhanced measures of levelised costs of energy.
This box is based on BEIS, OBR and DESNZ data from August 2020 and April 2023 .
An estimate of the full cost of different energy sources to the power system would need to reflect more than just the construction and operating costs of energy generators that are captured in the levelised cost of electricity (LCOE). For example, the dispatchability of the energy source would need to be taken into account: gas-fired power is very responsive to demand and can be turned on only when a unit of electricity is most valuable, whereas many renewables are weather-dependent. And, for a gas power plant, capacity at a given point in time is not correlated with the capacity of other generating technologies, whereas when the wind is not blowing or the sun not shining, all wind farms or solar plants in the same vicinity generate less energy, regardless of demand conditions. Where generation takes place further away, rather than closer to where it is needed, as is the case for offshore wind, this adds to the overall costs of delivering power to where it is used. And compared to gas-powered generators, where there are a few big stations to connect and integrate with the grid, many renewables (particularly solar and onshore wind) require many more smaller-scale generators to be connected and balanced on the grid, increasing the overall system costs.a
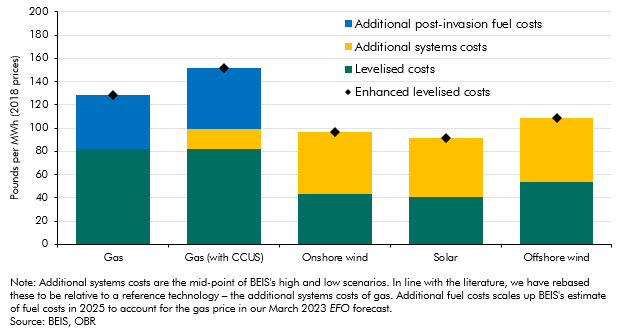
DESNZ (formerly BEIS) therefore produced estimates of ‘enhanced levelised costs’ (ELCOEs) in 2020.b In Chart B we add the ‘additional systems costs’ this metric incorporates on top of the basic ‘electricity generation costs’ of a reference technology – gas-powered generation. At pre-invasion prices, the ELCOEs for renewables are higher than the levelised cost of gas (the green bars), reflecting the greater additional systems costs (the yellow bars) associated with renewable generation compared to gas generation. Adding in the costs of the carbon capture usage and storage (CCUS) necessary to render gas carbon neutral (the yellow block in the second bar) leaves overall costs similar across all technologies at pre-invasion prices.c). To illustrate the additional costs of gas-fired power generation post-invasion, we have simply scaled up fuel costs to account for the percentage increase in gas prices in 2025 implied by our latest medium-term gas price forecast. This takes the ELCOEs for both gas measures (without and with CCUS) well above even the most expensive renewable technology.d
Chart B: Illustrative enhanced levelised costs of energy

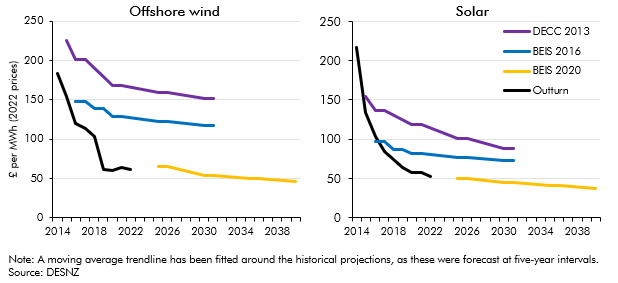
The relative LCOEs of different technologies, enhanced or not, will continue to evolve over time. And if the past is a reasonable guide to the future, that will make the comparison increasingly favourable to renewables, where costs have repeatedly fallen faster than predicted (Chart C).
Chart C: Successive forecasts of renewable LCOEs vs. outturns

This box was originally published in Fiscal risks and sustainability – July 2023
