
Relatively little time has passed since our November forecast and the outlook for the economy and public finances looks broadly the same. The economy has slightly more momentum in the near term, thanks to the unexpected strength of the world economy, but there seems little reason to change our view of its medium-term growth potential. And while the budget deficit looks likely to come in almost £5 billion lower this year than we expected in November, the explanations for this imply smaller downward revisions for future years. As a result, the Government’s headroom against its fiscal targets is virtually unchanged.
The Chancellor has kept to his word in announcing no new fiscal policy measures in the Spring Statement. The main Government decisions affecting this forecast are his decision to reduce the proportion of debt that will be issued as index-linked gilts, February’s local government finance settlement and decisions taken by the Scottish and Welsh Governments since the Chancellor’s Autumn Budget in November. These have modest fiscal implications.
Growth and employment have performed broadly as expected since November and we have made only small revisions to our economy forecast. The latest data show real GDP growth slowing from 1.9 per cent in 2016 to 1.7 per cent in 2017 (and to 1.4 per cent in the year to the fourth quarter of 2017). We expect growth of 1.5 per cent in 2018, slowing a little more in 2019, then picking up modestly over the subsequent three years. At 1.4 per cent a year, the average growth rate over the forecast is unchanged from November.
The vote to leave the European Union appears to have slowed the economy, but by less than we expected immediately after the referendum – thanks in part to the willingness of consumers to maintain spending by reducing their saving. But it is important not to put too much weight on early estimates of economic activity either side of the referendum, not least because the bottom-up measures of GDP growth in the National Accounts differ as to whether growth slowed down, speeded up or remained stable between 2016 and 2017.
The biggest surprise in the economic data released since November is that productivity growth – measured as output per hour – has been much stronger than expected. But that reflects a much weaker path for average hours worked, rather than stronger output or weaker employment growth. The fall in average hours over the second half of 2017 is the largest since mid-2011 and second largest since the financial crisis. But in 2011 the fall in hours and associated pick-up in productivity growth proved to be erratic and were soon reversed. We assume for now that the same will be true on this occasion.
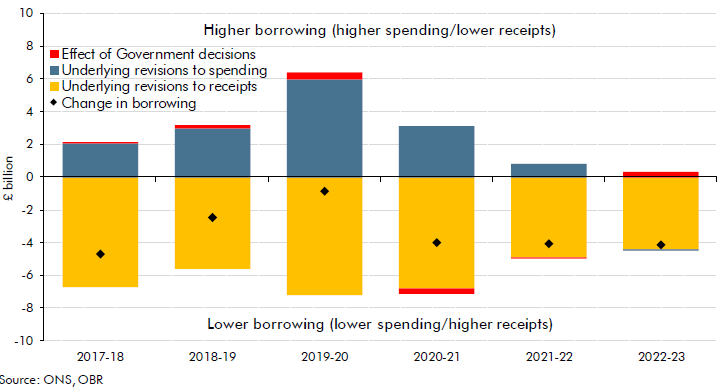
We now expect the budget deficit to come in at £45.2 billion this year, £4.7 billion less than we forecast in November and fractionally lower than the latest estimate for 2016-17. Receipts growth in general has been a little stronger than expected, while self-assessment income tax receipts look likely to fall by £0.2 billion rather than the £3.1 billion we assumed in November. The downward revision to the deficit is smaller than you would get simply by extrapolating the data for the year to date, largely because we expect local authorities to underspend their budgets by less than the Office for National Statistics is currently provisionally assuming. Firm outturn data will not be available before September.
Borrowing is forecast to continue falling from 2018-19 onwards, with the deficit dropping below 2 per cent of GDP next year and below 1 per cent of GDP in the final year of the forecast. The downward revision relative to November diminishes over the next two years, thanks to upward revisions to debt interest and some other spending. Thereafter it is broadly stable at around £4 billion a year. But given the signs of greater cyclical pressure in the economy, we have revised our assumptions about the output gap and the extent to which borrowing is cyclical or structural. We see much of the improvement in borrowing since November as cyclical, with our forecast for the structural deficit little changed on average and improved by just £0.3 billion in the Government’s target year of 2020-21.
Chart 1: Public sector net borrowing revisions since November
On this basis, our central forecast implies that the Government’s fiscal mandate – for cyclically adjusted borrowing to lie below 2 per cent of GDP in 2020-21 – would be met by a margin of 0.7 per cent of GDP, unchanged from our November forecast. Public sector net debt falls by 3.0 per cent of GDP in 2020-21, meeting the supplementary debt target – again by the same margin as in our November forecast. And the subset of spending covered by the welfare cap remains below the stipulated level in 2022-23.
Our forecasts continue to be based on broad-brush assumptions about the economy and public finances after the UK’s exit from the EU, pending a meaningful basis upon which to predict the precise end-point of the Brexit negotiations. One area where sufficient clarity is now available to be more specific relates to the financial settlement – the ‘divorce bill’ – that the UK will pay after leaving the EU on 29 March 2019. The December 2017 joint report by the UK and EU negotiators detailed the components of this settlement. The Treasury estimated at the time that it would amount to £35 billion to £39 billion. Using assumptions consistent with our central economic and fiscal forecasts, we estimate the settlement would cost £37.1 billion, with around 75 per cent falling due within our five-year forecast period.
Read more in the March 2018 Economic and fiscal outlook