Both incapacity and disability benefit onflows have grown substantially since 2018-19. In this box we compared the different drivers of these respective increases in onflows and drew some lessons from the granular disability benefit data for how incapacity onflows may have been changing.
This box is based on DWP, OBR data from September 2024 .
Personal independence payment (PIP) is the working-age disability benefit which helps individuals deal with the extra costs of having a disability. Unlike incapacity benefits, PIP is not means-tested and is available to those in-work. Only around one-sixth of PIP recipients are in work, a number that has been fairly stable over recent years.
There is significant overlap between disability and incapacity benefits. Around two-in-three claimants who received ESA or UC also received PIP or DLA, and around two-in-three claimants who received PIP or DLA also received ESA or UC in November 2020. However, the two types of benefits have different purposes and trends over time, as discussed in Chapter 1. This report mainly focuses on incapacity benefits, but there are interesting differences between trends in onflows for incapacity and disability benefits, with somewhat more granular data available for disability benefits. This box therefore summarises trends in PIP onflows, as a point of comparison for the incapacity benefits onflows trends discussed in this chapter.
Decomposing onflows to personal independence payment
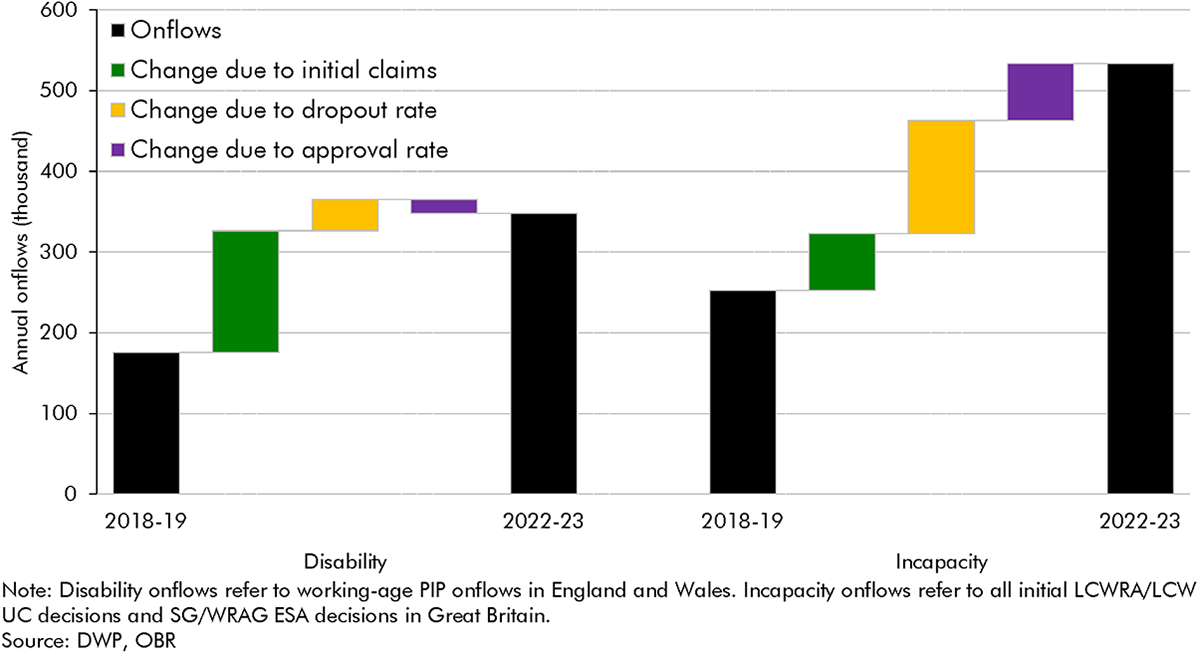
Working-age onflows to PIP since 2018-19 have grown at a similar rate to incapacity benefits onflows, with both roughly doubling over that period. Working-age PIP onflows increased by 98 per cent from 2018-19 to 2022-23, rising from 175,000 to 348,000. Incapacity benefits onflows increased by 111 per cent over the same period (from 252,000 in 2018-19 to 533,000 in 2022-23).a The drivers of higher onflows are very different across the two benefits, however. Chart D below decomposes these drivers:
- Initial claims: new claims for PIP increased by 310,000 (67 per cent) between 2018-19 and 2022-23, a much larger increase than new claims for incapacity benefits (which rose by 140,000, or 21 per cent). Higher new claims accounted for nearly nine-tenths of the increase in PIP onflows, compared to one-quarter of the increase in incapacity onflows.
- Dropout rate: the dropout rate for PIP claims fell from 26 per cent in 2018-19 to 14 per cent in 2022-23, accounting for one-fifth of the increase in onflows. In contrast more than half of the increase in incapacity onflows over this period is explained by a lower dropout rate.
- Approval rate: where the incapacity approval rate increased from 66 per cent in 2018-19 to 81 per cent in 2022-23, the PIP approval rate decreased slightly from 55 per cent to 51 per cent over the same period. This fall in the approval rate decreased PIP onflows by 17,000 between 2018-19 and 2022-23.
Chart D: Changes in incapacity and disability benefits onflows due to initial claims, dropout and approval rates

Understanding dropouts from the personal independence payment claim process
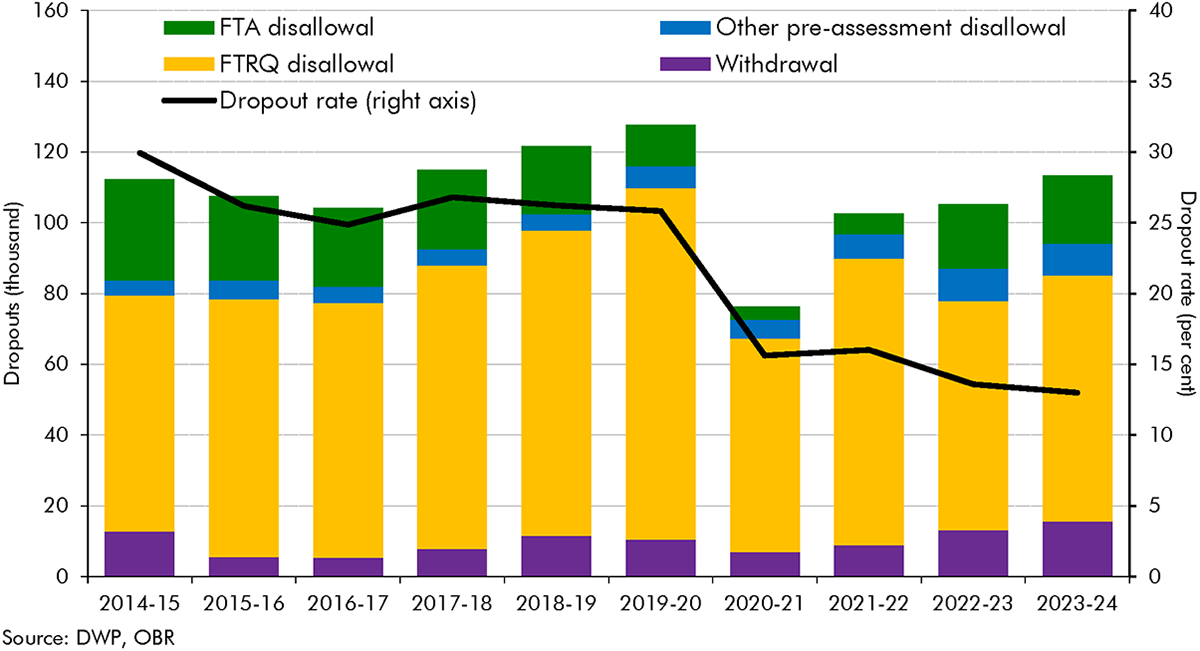
Dropouts from PIP can be split into the following groups: claimants withdrawing their claim; claimants failing to return the PIP questionnaire (FTRQ); claimants dropping out between submitting a questionnaire and DWP referring them for assessment; and claimants failing to attend their assessment (FTA).
As shown in Chart E, most claimants who dropout fail to return the PIP questionnaire (FTRQ). These ‘FTRQ disallowals’ explain most of the fall in the dropout rate after 2019-20, falling from 100,000 in 2019-20 (20 per cent of initial claims) to 60,000 in 2020-21 (12 per cent of initial claims). This decreasing trend in FTRQ disallowals has brought the dropout rate down to 13 per cent in 2023-24, half its pre-Covid level.
DWP changed the process for submitting the PIP questionnaire (‘PIP2′) in March 2020 to include a reminder and an automatic extension of the deadline for submitting the PIP2 form by two weeks if a claimant runs out of time. And since March 2020, claimants have been able to submit PIP2 forms over email rather than by post. These changes, which are likely to have reduced FTRQ disallowals, mirror changes in the UC fit note verification process discussed in this chapter. This evidence therefore supports the idea that a fall in the number of ESA and UC claimants dropping out due to expired fit notes similarly explains the falling incapacity benefits dropout rate.
Chart E: PIP dropouts by reason

Understanding the primary conditions of working-age personal independence payment onflows
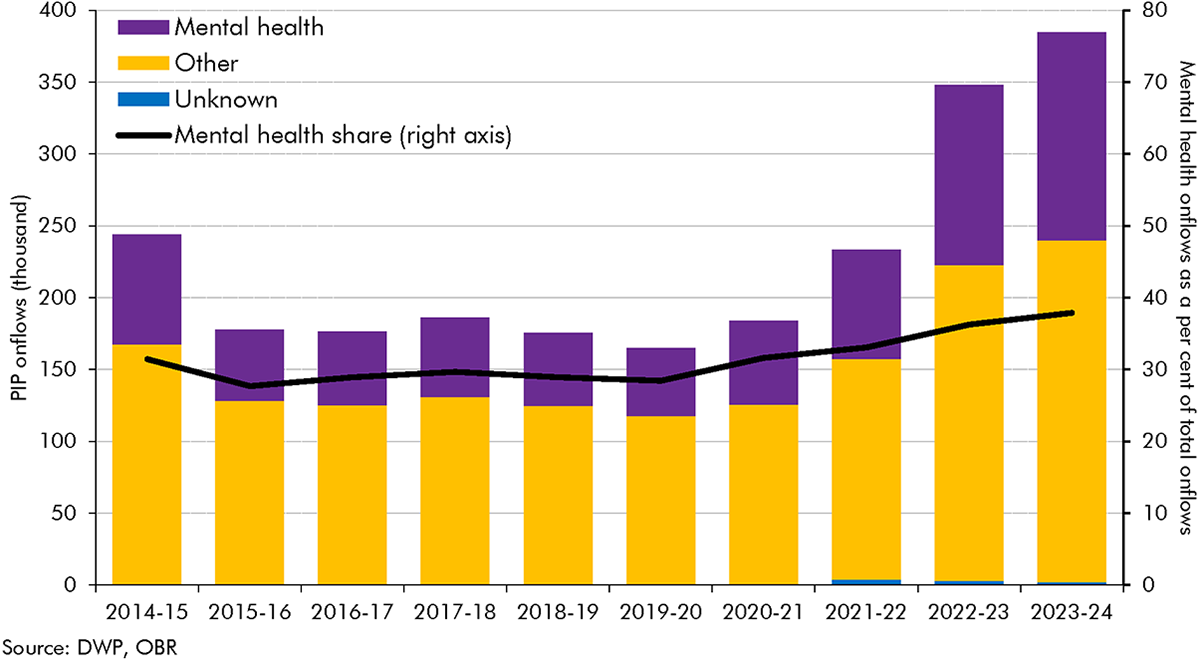
PIP onflows can be broken down by their primary health condition. Chart F shows PIP onflows for mental health conditions and all other conditions. Up until 2019-20, the share of onflows that were for mental health conditions was roughly flat; following the onset of Covid, this share has risen by a third, up from 28 per cent in 2019-20 to 38 per cent of onflows in 2023-24.
Chart F: PIP onflows by primary health condition

Unlike PIP, we do not know if the rise in UC onflows relates to claimants with a primary mental health condition, because UC assessment data does not record the primary condition of claimants (it instead records all conditions, and only since January 2022). A consistent time series of data on UC incapacity claimants’ conditions – ideally including primary condition for consistency with ESA – would allow us to better understand changes over time, and whether the rise in UC incapacity onflows reflects the trends seen in PIP and wider health surveys.
This box was originally published in Welfare trends report – October 2024
