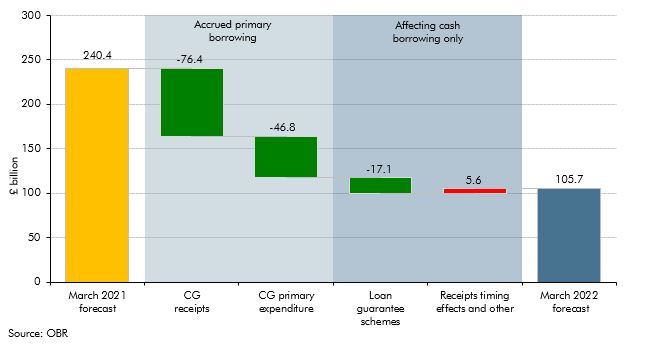
Forecasts for the government's cash borrowing in 2021-22 were revised significantly between the March 2022 and October 2021 forecast, with even larger revisions between March 2021 and March 2022. In this box we decomposed the sources of these revisions, and explained why cash borrowing outturn was much lower than forecast in March 2021, as well as why the revisions to cash borrowing were much higher than those for accrued borrowing.
This box is based on OBR data from March 2021 and March 2022 .
We forecast many different measures of government borrowing. The headline measure of public sector net borrowing or ‘PSNB’ covers the entire public sector (including central government, local authorities, and public corporations including the Bank of England) and is measured on an accruals basis (which focuses on when a transaction occurs rather than when the cash is paid over). An important narrow measure we forecast is ‘CGNCR ex’, which covers only central government borrowing and is measured on a cash basis, so it reflects the cash government needs to raise to conduct its affairs in a given year.a The Treasury uses this measure as the basis for the Debt Management Office’s (DMO’s) financing remit – the gilts and Treasury bills issued each year to service those cash needs and bridge the gap between cash inflows and outflows.
CGNCR ex has come in much lower than expected this year. Our latest forecast for 2021-22 is £48.3 billion below our October forecast and £131.2 billion below our March 2021 forecast. That large shortfall has resulted in more gilts being issued than are necessary to finance this year’s cash deficit, leading to a build-up of cash reserves at the DMO that reduces the amount of gilts that will need to be issued next year to cover the 2022-23 cash deficit.
Our latest forecast for CGNCR ex in 2021-22 is £109.2 billion, which is 55 per cent lower than our forecast from a year ago and down 67 per cent on the post-war peak it reached in 2020-21. Roughly two-thirds of the CGNCR revision comes from changes that also affect PSNB and one-third from differences between the two measures. In total the revision since March 2021 is £25.1 billion larger for CGNCR ex than for PSNB, with £23.9 billion coming from the inflation driven uplift on index-linked gilts that affects PSNB in-year but only hits cash measures of the deficit over many decades as those gilts are redeemed.
So how did cash borrowing this year come to surprise us by such a large margin? Abstracting from higher accrued spending on index-linked gilts, Chart G shows that:
- Central government accrued receipts have been revised up by £77.2 billion. This reflects both a stronger economic rebound than predicted in March 2021, but also growth in receipts outperforming growth in nominal GDP for the reasons discussed in Box 3.1.
- Central government accrued primary (non-interest) expenditure has been revised down by £48.7 billion. This largely relates to overestimates of departmental spending (due to large underspends against plans set by the Treasury) and welfare spending (as unemployment has been considerably lower than forecast).
- Cash outlays associated with calls on pandemic loan guarantee schemes have been close to zero so far, in contrast to the £17.1 billion this year assumed in our March 2021 forecast. In part this reflects loan repayment holidays subsequently introduced by the Chancellor that will have postponed some loan defaults, but it also reflects significant downward revisions to the total size of write-offs expected (see paragraph 3.102).
- Receipts timing effects and other factors offset £11.9 billion of the downward revision. In particular, a reduction in the share of student loan outlays recorded as spending reduces accrued borrowing with an offsetting upward revision in timing effects. This is partly offset by cashflow timing effects associated with stronger cash receipts over and above the effect of stronger accrued receipts. The remainder includes differences in financial asset sales and other central government net lending, as well as other, smaller differences between the cash and accrued forecasts.
Chart G: CGNCR ex revisions between March 2021 and March 2022 forecasts

This box was originally published in Economic and fiscal outlook – March 2022
