
Compared to March 2025, the pre-measures receipts forecast has increased by £16 billion in 2029-30. In this box, we explored how changes in the economy forecast drove these changes to the tax forecast.
This box is based on ONS data from October 2025 .
Compared to March 2025, the pre-measures receipts forecast has increased by £16 billion in 2029-30. In this box, we explore how changes in the economy forecast drove these changes to the tax forecast including through:
- the 0.3 percentage point a year downgrade to our productivity forecast;
- a 0.5 percentage point average increase in our pre-measures forecast of CPI inflation this year and next, which contributes to a 0.9 percentage point average increase in our pre-measures forecast for nominal earnings growth this year and next, and a 0.4 percentage point average increase in nominal consumption growth over this year and next; and
- how these changes in the forecast for nominal GDP and its components interact with the different effective tax rates on those components.
Effective tax rates (ETRs) represent the average tax rate paid on a component of expenditure and income. Chart A shows that there is a difference of around 20 percentage points between the ETRs on labour (40 per cent) and corporate (17 per cent) incomes, and between those on consumption (10 per cent) and business investment (-10 per cent) expenditure. This means that growth in labour income is more tax-rich than growth in corporate profits, and similarly that growth in consumption is more tax-rich than growth in business investment.
Since the pandemic, the ETRs on labour income and corporate profits have both risen, which has broadly maintained the differential between them. The freezing of personal tax thresholds and strong nominal earnings growth have brought an increasing number of individuals into paying tax, and into higher bands (Box 3.3). This causes the ETR on labour income to rise to a forecast 40 per cent by 2030-31 from below 35 per cent before the pandemic.a The ETR on corporate profits increased by a similar amount due to the rise in the corporation tax rate from 19 per cent to 25 per cent in April 2023. The ETRs on consumption and business investment, and the differential between them, are expected to remain broadly flat from 2021-22.
Chart 4A: Effective tax rates on income and expenditure
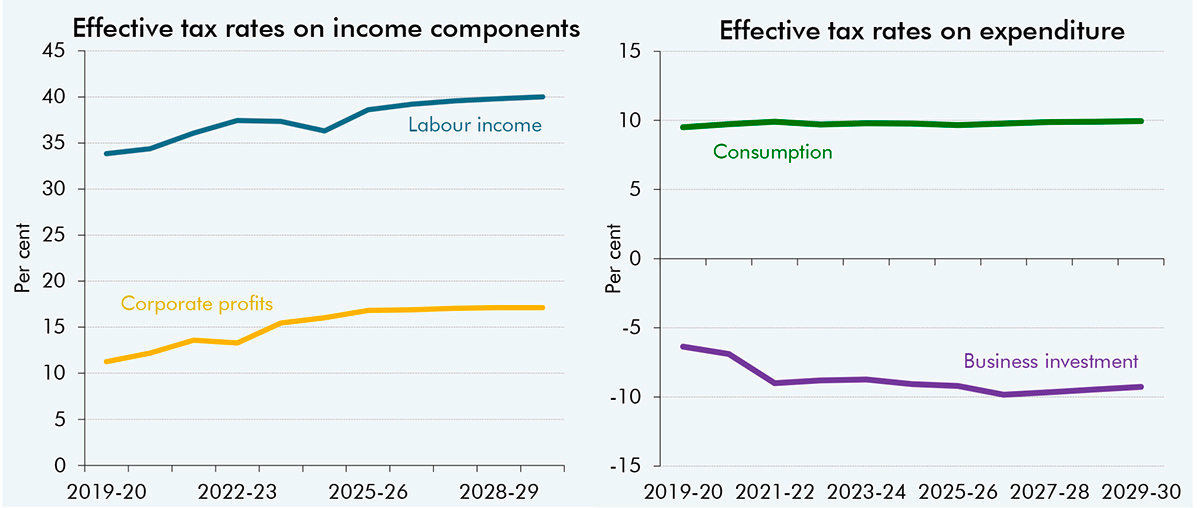
Note: These effective tax rates represent the average tax rate paid on expenditure and income. The negative effective tax rate for business investment represents the short-run impact of relieving corporation tax liabilities when making investments.
Source: ONS, OBR
These differentials in effective tax rates help to explain why the pre-measures receipts forecast in 2029-30 is £16 billion higher than in March (Chart B), despite the downgrade to productivity growth in this forecast. Based on our standard ready-reckoners, the reduction in the trend productivity growth forecast of around 0.3 percentage points a year from 2026-27 would have been expected to mechanically reduce receipts by £16 billion in 2029-30. This is based on holding all other forecast judgements constant, with compositional shares of income and expenditure remaining unchanged from our March forecast.b However, a number of other judgements in the economy forecast more than offset this.c Specifically:
- A higher near-term inflation forecast by an average 0.5 per cent in this year and next increases the forecast size of the nominal economy and therefore leads to higher forecasts for nominal consumption, VAT receipts, profits, corporation tax, and earnings, with the latter driving higher personal taxes, especially with frozen personal tax thresholds.d Overall, we estimate this mechanically increases the pre-measures forecast for nominal receipts by £14 billion in 2029-30.
- Our forecast for growth in the composition of income within GDP is also now more skewed toward relatively tax-rich labour income and less skewed toward less heavily taxed corporate profits. We now expect a shallower decline in the labour share of income from March, pushing up wage growth, and lower corporate profit growth due to the rate of return on capital having recently fallen by less than previously thought (see paragraphs 2.47 and 2.48 for more details). All else equal, this would increase receipts by £5 billion in 2029-30.
- We also expect more fiscally favourable growth in the composition of expenditure within GDP. Consistent with the lower forecast for profits, we have revised down cumulative growth in corporate investment by more than nominal GDP. But we have revised up the share of nominal GDP that goes to consumption, consistent with higher wage growth. The composition of nominal consumption has also shifted toward goods that pay the standard rate of VAT. These changes in the composition of expenditure are estimated to increase receipts by £5 billion in 2029-30.
- Other receipts impacts explain the rest of the difference in our pre-measures receipts forecast from March. These include a boost to capital gains tax receipts due to higher equity prices, higher business rates due to a changed assessment of the impact of future revaluations, and increases to forecasts for some fiscally neutral receipts.
Chart 4B: The indicative impact of forecast changes on pre-measures receipts
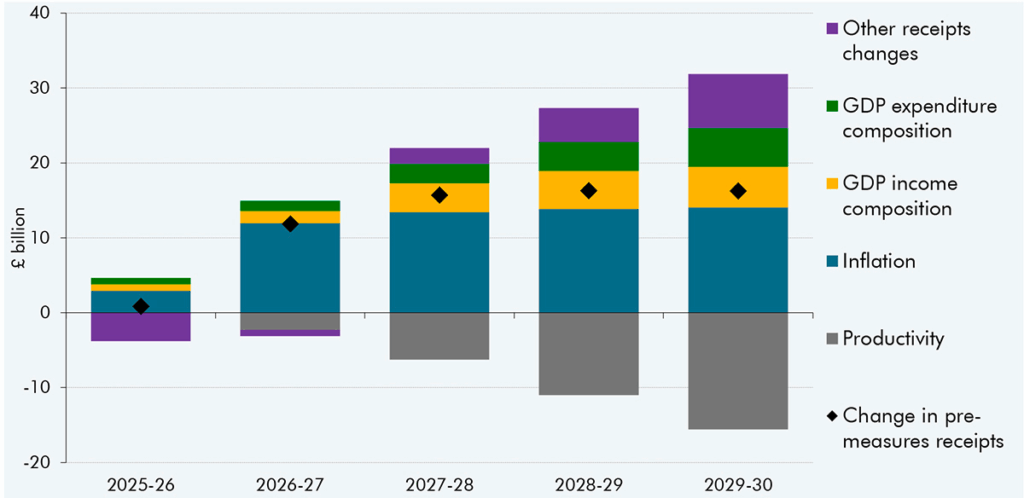
Note: This analysis on the fiscal impact of changes to the GDP expenditure and income composition includes changes to corporate profits, earnings, nominal consumption, and business investment. It excludes changes to other income and expenditure components.
Source: ONS, OBR
This box was originally published in Economic and fiscal outlook – November 2025