
The UK economy has slowed this year as households’ real incomes and spending have been squeezed by higher inflation. GDP growth has been a little weaker than we expected in March, but once again we have been more surprised by the strength of employment growth and the corresponding weakness of productivity growth. The persistence of weak productivity growth does not bode well for the UK’s growth potential in the years ahead.
That said, the public finances have performed better than expected. The ONS has revised borrowing in 2016-17 sharply lower, relative to its initial estimate and our March forecast. And the deficit has continued to fall in the first half of 2017-18. We have revised borrowing down by £8.4 billion to £49.9 billion for the full year, but this is still slightly up on 2016-17 because timing effects boosted receipts last year and will lower them later this year.
We have lowered our real GDP forecast in every year. We now expect growth to average 1.4 per cent a year over the next five years, slowing a little over the next two (as public spending cuts and Brexit-related uncertainty weigh on the economy) and picking up modestly thereafter as productivity growth quickens. The main reason for lowering our GDP forecast since March is a significant downward revision to potential productivity growth, reflecting a reassessment of the post-crisis weakness and the hypotheses to explain it.
The combined effects of a better fiscal position now, but weaker prospects looking forward, have led us to revise up our forecast for the budget deficit by increasing amounts over the next five years, even before accounting for the Budget measures. In the Government’s fiscal target year of 2020-21, our underlying upward forecast revision of £13.7 billion absorbed roughly half the headroom against the ‘fiscal mandate’ shown in our March forecast.
Faced with a weaker outlook for the economy and the public finances, and growing pressures on public services following years of cuts, the Government has chosen to deliver a significant near-term fiscal giveaway. This adds £2.7 billion to borrowing next year and a larger £9.2 billion (0.4 per cent of GDP) in 2019-20. The package includes net tax cuts (to fuel duty, inevitably, and stamp duty for first-time buyers), a significant easing in previously planned cuts to current departmental spending and a boost to capital spending. Together they provide a modest boost to GDP growth in the years we expected it to be weakest. Consistent with the pattern of many past fiscal events, the policy easing is then scaled back in future years, with a small fiscal tightening ultimately pencilled in for 2022-23 in the form of further cuts in public services spending as a share of GDP.
Despite the deterioration in our underlying forecast, the tax and spending giveaway, and extra lending through Help to Buy, the Government has ensured that net debt still falls fractionally as a share of GDP in 2018-19 and by more beyond. It has achieved this largely by announcing fresh sales of RBS shares and by passing regulations that ease local and central government control over housing associations in England. In response, the Office for National Statistics has announced that it will treat them as private sector entities from the point at which the regulations take effect. This has reduced our borrowing forecast by around £3¾ billion a year and reduced our debt forecast by between £67 and £81 billion. But housing associations’ role as providers of a public service means that this accounting change has no material effect on the underlying health and riskiness of the public finances – if the sector faced serious financial difficulties in the future, it seems equally likely that the Government of the day would choose to stand behind it whatever its statistical classification.
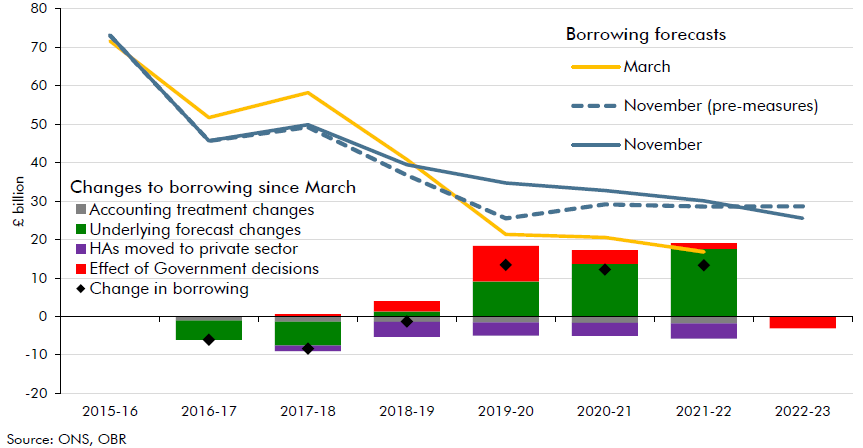
Chart 1 shows how the different factors have affected our borrowing forecast since March. Our underlying forecast changes and the Government’s fiscal loosening generally push the deficit higher while statistical changes have reduced it more modestly. Absent Budget measures, borrowing would have troughed in 2019-20 and fluctuated thereafter. Once Government decisions are factored in, the deficit declines more smoothly over time.
Chart 1: Public sector net borrowing
On this basis, our central forecast implies that the Government’s fiscal mandate – for cyclically adjusted borrowing to lie below 2 per cent of GDP in 2020-21 – would be met by a margin of 0.7 per cent of GDP, down by just under half relative to our March forecast. This measure of the deficit falls below 2 per cent in 2018-19. Public sector net debt falls by 3.0 per cent of GDP in 2020-21, meeting the supplementary debt target too. And the subset of spending covered by the welfare cap remains below the stipulated level in 2021-22. A new welfare cap – the fourth to be announced in four years – has been set in this Budget.