"It is the duty of the Office to examine and report on the sustainability of the public finances"
Coronavirus analysis
This page brings together all coronavirus databases and analysis produced by the OBR on an ad-hoc basis or within our core documents between April 2020 and March 2021. The impact of thecoronavirus outbreak and policy measures on the economy and public finances continues to be assessed in our regular core publications.
In addition to the impact of the coronavirus outbreak on public health and families’ wellbeing, the associated economic disruption and the policy measures put in place to support individuals and businesses will raise the budget deficit and public debt significantly. We produced an initial illustrative scenario to assess these effects on 14 April 2020 and developed this scenario analysis further in the Fiscal sustainability report on 14 July 2020. We then updated these scenarios in our November 2020 Economic and fiscal outlook on 25 November 2020. For our March 2021 Economic and fiscal outlook on 3 March 2021, we updated only the central forecast and framed it against the backdrop of the upside and downside scenarios we produced in November 2020 which remained a reasonable guide to the range of possible future outcomes at the time.
Coronavirus scenarios
On 14 April 2020 we published an illustrative three-month lockdown scenario that assessed the potential impact of the coronavirus on the economy and public finances. On 14 July 2020 we updated this analysis, presenting three scenarios in our Fiscal sustainability report. These reflected the economic and fiscal data up to 19 June and policy announcements up to 26 June. On 25 November 2020, we updated these three scenarios in our Economic and fiscal outlook. For our March 2021 Economic and fiscal outlook on 3 March 2021, we updated only the central forecast and framed it against the backdrop of the upside and downside scenarios we produced in November which remained a reasonable guide to the range of possible future outcomes.
The March 2021 EFO central forecast and the November 2020 EFO our scenario assumptions were:
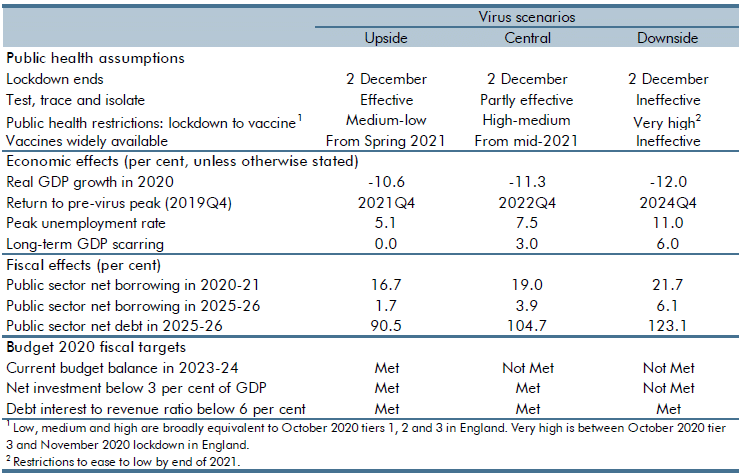
An upside scenario in which the second lockdown and an effective test, trace, and isolate system brought the second wave of infections under control and effective vaccines were rolled out rapidly. That allowed an early easing of restrictions, with output rebounding to its pre-pandemic level by the end of 2021.
A central forecast in which the country exited the second lockdown into a stricter set of tiered public health restrictions, with a less effective test, trace, and isolate system, and slower rollout of the vaccines. That allowed only a more gradual recovery, with output regaining its pre-pandemic level by the end of 2022.
A downside scenario in which the second lockdown failed to reduce cases to manageable numbers, test, trace, and isolate was overwhelmed, and stricter restrictions were imposed through the spring of this year. Vaccines proved ineffective in keeping the virus in check giving rise to a third wave of infections over the winter. This required a more substantial, costly, and permanent economic adjustment, with output only regaining its pre-pandemic levels at the end of 2024.
More than a year on from its start, the coronavirus pandemic continues to exact a heavy toll in lives and livelihoods. Around the globe, more than 100 million people have had the virus and around 2½ million have died from it, and world GDP fell by 3½ per cent in 2020 as governments imposed public health restrictions in an attempt to control the virus. The UK has been hit particularly hard. Following a resurgence of infections over the winter, around 1 in 5 people have so far contracted the virus, 1 in 150 have been hospitalised, and 1 in 550 have died, the fourth highest mortality rate in the world. And GDP fell 9.9 per cent in 2020, the largest decline in the G7. While output partially recovered in the second half of last year – and somewhat more strongly than we previously thought – the latest lockdown and temporary disruption to EU-UK trade at the turn of the year is expected to result in output falling again in the first quarter of this year.
The pandemic has, however, also spurred a global scientific effort to develop new and effective vaccines at unprecedented speed, with the UK in the vanguard of their discovery and rollout. More than 200 million people worldwide have already received their first dose of one of those vaccines. In the UK, that figure has topped 20 million – more than a third of all adults and the fourth highest vaccination rate worldwide. Early evidence from the UK and other countries indicates that the vaccines are broadly as effective in reducing illness and death as suggested in clinical trials. The Government aims to have offered a first dose to everyone over 50 or at risk by 15 April and to all adults by 31 July, slightly earlier than assumed in our November central forecast.
The rapid rollout of effective vaccines offers hope of a swifter and more sustained economic recovery, albeit from a more challenging point than we forecast in November. The easing of public health restrictions in line with the Government’s 22 February Roadmap should permit a rebound in consumption and output through this year, partially supported by the release of extra savings built up by households during the pandemic. GDP is expected to grow by 4 per cent in 2021 and to regain its pre-pandemic level in the second quarter of 2022, six months earlier than we forecast in November. Unemployment still rises by a further 500,000 to a peak of 6.5 per cent at the end of 2021, but the peak is around 340,000 less than the 7.5 per cent assumed in our November forecast, thanks partly to the latest extension of the furlough scheme. The pandemic is nevertheless still expected to lower the supply capacity of the economy in the medium term by around 3 per cent relative to pre-virus expectations.
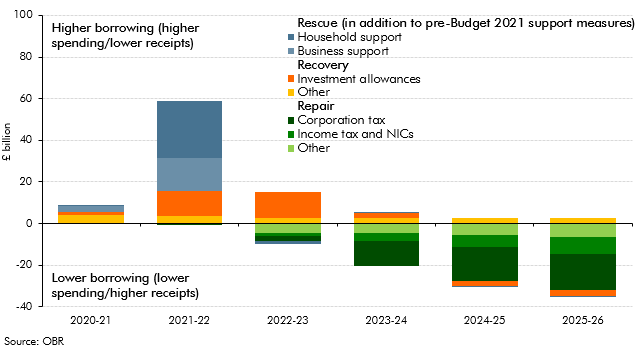
Faced with an economy that is weaker in the near term but rebounding faster than we forecast in November, the Chancellor has done three things in this Budget. First, he has extended the virus-related rescue support to households, businesses and public services by a further £44.3 billion, taking its total cost to £344 billion. Second, he has boosted the recovery, most notably through a temporary tax break costing more than £12 billion a year that encourages businesses to bring forward investment spending from the future into this year and next. Third, as the economy normalises, he has taken a further step to repair the damage to the public finances in the final three years of the forecast by raising the headline corporation tax rate, freezing personal tax allowances and thresholds, and taking around £4 billion a year more off annual departmental spending plans, raising a total of £31.8 billion in 2025-26 (Chart 1).
Chart 1: The impact of Budget measures on public sector net borrowing
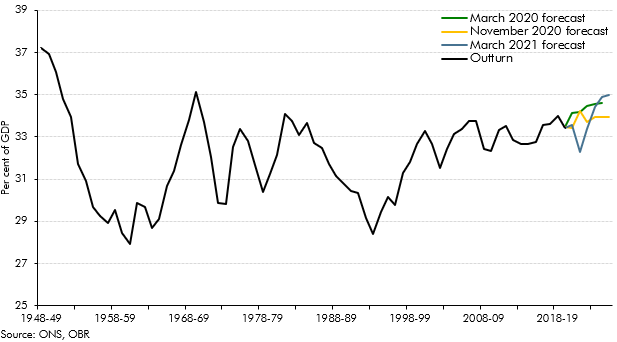
The tax rises announced in this Budget increase the tax burden from 34.0 to 35.0 per cent of GDP in 2025-26, its highest level since Roy Jenkins was Chancellor in the late 1960s (Chart 2). Over half of this increase is as a result of a 6 percentage point increase in the corporation tax rate to 25 per cent. This brings the headline corporation tax rate back into line with the advanced economy average but still well below its long-run historical average in the UK of around 35 per cent. However, the widening of the tax base over the past decade means that this relatively modest increase in the headline rate leaves corporation tax raising 3.2 per cent of GDP in revenue by 2025-26, its highest since 1989-90. Freezes to the income tax personal allowance and higher rate threshold for four years bring 1.3 million people into the tax system and create 1 million higher rate taxpayers by 2025-26.
Chart 2: Tax as a share of nominal GDP
As the economy reopens and emergency fiscal support is withdrawn, government borrowing is forecast to fall from a peacetime high of £355 billion (16.9 per cent of GDP) in 2020-21 to £234 billion (10.3 per cent of GDP) in 2021-22 (still higher than the 2009-10 peak at the height of the financial crisis). In 2022-23, as fiscal policy moves from rescue to recovery, the deficit falls back to £107 billion (4.5 per cent of GDP). Thereafter, as policy focuses on repair and taxes rise, borrowing falls to £74 billion (2.8 per cent of GDP) in 2025-26.
Headline debt tops 100 per cent of GDP this year and remains above that level throughout our forecast. Underlying debt (excluding the Bank of England) peaks at 97.1 per cent of GDP in 2023-24 before falling back to 96.8 per cent of GDP by the end of the forecast. Despite the stock of debt reaching its highest level as a share of the economy since 1958-59, the costs of servicing that debt falls to a historic low of just 2.4 per cent of total revenues thanks to the decline in interest rates. Unlike previous post-crisis Chancellors who cut back capital spending to reduce borrowing and rein in debt, this one has left in place the significant increase in public investment, from 1.9 per cent of GDP last year to 2.7 per cent of GDP by 2025-26, that he announced a year ago.
The Chancellor has not set new fiscal targets in this Budget (despite two of the existing ones expiring this month) and is instead proceeding with the review of the fiscal framework proposed in last year’s Budget. But the absence of formal fiscal targets does not mean that the Chancellor has not been guided by particular metrics when selecting his medium-term Budget policies. The tax rises and spending cuts he has announced are sufficient to eliminate all but a £0.9 billion current budget deficit in 2025-26, while they are just enough to see underlying public sector net debt as a share of GDP fall by a similarly small margin of £0.7 billion in 2024-25 and £4.1 billion in 2025-26.
Uncertainty around the economic outlook remains considerable, with the course of the pandemic still the greatest single risk. A quicker rollout of vaccines with greater effectiveness in reducing infection and illness, the development of new therapies and treatments, or a faster rundown in household savings built up during the pandemic could deliver a swifter economic recovery and less medium-term scarring. Against that, setbacks in the rollout of the vaccines, the emergence of new vaccine-resistant variants, or reduced compliance with residual public health restrictions could force governments back into periodic lockdowns, with more adverse consequences for the economy in the short and medium term. So, the upside and downside scenarios set out in our November Economic and fiscal outlook (EFO) remain a reasonable guide to the range of possible future outcomes.
Assuming the Chancellor can maintain the tax burden close to historic highs, the main fiscal risks come from the legacy of the pandemic for public services. While public spending is set to be 2 per cent higher as a share of GDP in 2025-26 than in 2019-20, most of this reflects increases in health, education and public investment announced before the pandemic. The Government’s spending plans make no explicit provision for virus-related costs beyond 2021-22, despite its Roadmap recognising that annual vaccination programmes and continued testing and tracing are likely to be required. The Government will also need to decide how to catch up on services disrupted by the virus, notably the backlogs in non-urgent procedures in the NHS that have built up and the months of lost or impaired schooling for some pupils.
Faced with these post-pandemic pressures, the Government has so far cut more than £15 billion a year from departmental resource spending from 2022-23 onwards, setting up a challenging Spending Review later this year. The public finances are also much more sensitive than they were to rises in short-term interest rates, due to a combination of the higher debt stock and its effective refinancing by the Bank of England through quantitative easing, which has shortened the median maturity public debt from more than seven years before the financial crisis to less than two today. To illustrate this risk, the 30 basis point increase in interest rates that has happened since we closed our forecast on 5 February would already add £6.3 billion to the interest bill in 2025-26 published in this document. All else equal, that would be enough to put underlying debt back on a rising path relative to GDP in every year of the forecast.
The coronavirus pandemic has delivered the largest peacetime shock to the global economy on record. It has required the imposition of severe restrictions on economic and social life; driven unprecedented falls in national income; fuelled rises in public deficits and debt surpassed only in wartime; and created considerable uncertainty about the future. The UK economy has been hit relatively hard by the virus and by the public health restrictions required to control it.
During the first wave of infections, the UK locked down later and for longer than some of its European neighbours and experienced a deeper fall and slower recovery in economic activity. A resurgence of infections is now in progress across Europe and North America, prompting the tightening of public health restrictions and reimposition of national lockdowns and taking the wind out of an already flagging recovery. That includes the UK, where GDP is set to fall by 11 per cent this year – the largest drop in annual output since the Great Frost of 1709.
The virus has also exacted a heavy and mounting toll on the public finances. In our central forecast, receipts this year are set to be £57 billion lower, and spending £281 billion higher, than last year. The Government has committed huge sums to treat the infected, control the spread of the virus, and cushion its financial impact on households and businesses. As support has been expanded and extended, including in the wake of the second wave of infections, its total cost this year has risen from £181 billion at the time of the Summer Economic Update, to £218 billion at the time of the Winter Economy Plan, to £280 billion in this forecast.
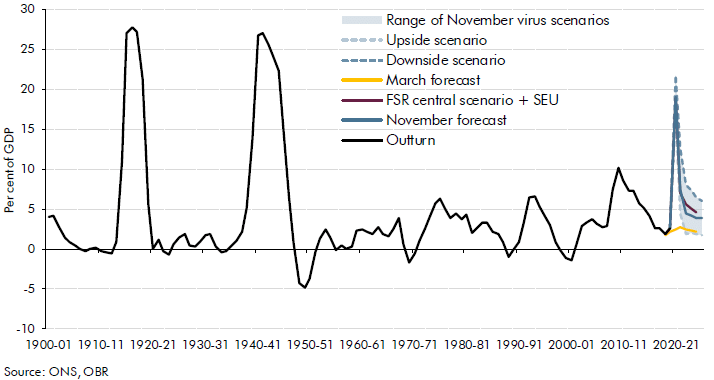
In our central forecast, the combined impact of the virus on the economy and the Government’s fiscal policy response pushes the deficit this year to £394 billion (19 per cent of GDP), its highest level since 1944-45, and debt to 105 per cent of GDP, its highest level since 1959-60 (Chart 1.1). Borrowing falls back to around £102 billion (3.9 per cent of GDP) by 2025-26, but even on the loosest conventional definition of balancing the books, a fiscal adjustment of £27 billion (1 per cent of GDP) would be required to match day-to-day spending to receipts by the end of the five-year forecast period.
Chart 1.1: Public sector net borrowing: central forecast and scenarios
The support provided to households and businesses has prevented an even more dramatic fall in output and attenuated the likely longer-term adverse effects of the pandemic on the economy’s supply capacity. And the Government’s furlough scheme has prevented a larger rise in unemployment. Grants, loans, and tax holidays and reliefs to businesses have helped them to hold onto workers, keep up to date with their taxes, and avoid insolvencies. Nonetheless, we anticipate a significant rise in unemployment – to 7.5 per cent in our central forecast – as this support is withdrawn in the spring.
The economic outlook remains highly uncertain and depends upon the future path of the virus, the stringency of public health restrictions, the timing and effectiveness of vaccines, and the reactions of households and businesses to all of these. It also depends on the outcome of the continuing Brexit negotiations. In such circumstances, the value of a single ‘central’ forecast is limited.
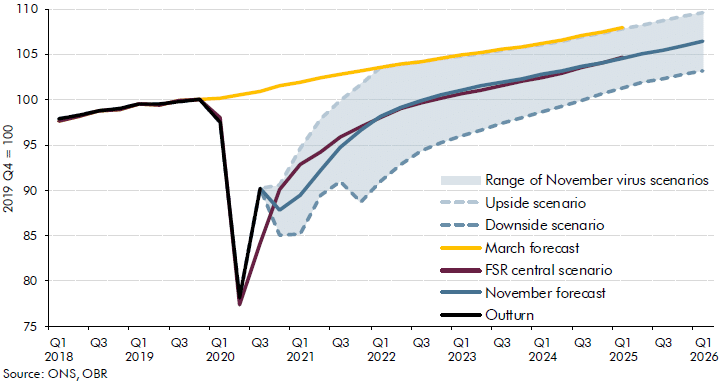
We therefore present three scenarios for the virus: an upside scenario, in which lockdown succeeds in bringing the second wave of infections under control and the rapid rollout of effective vaccines enables output to return to its pre-virus level late next year; a central one, in which restrictive public health measures need to be kept in place until the spring and vaccines are rolled out more slowly, leading to a slower return to pre-virus levels of activity at the end of 2022; and a downside one, in which lockdown has to be extended, vaccines prove ineffective in keeping the virus in check, and a more substantial and lasting economic adjustment is required with economic activity only recovering to its pre-virus level at the end of 2024 (Chart 1.2). In the upside scenario, output eventually returns to its pre-virus trajectory, but output is left permanently scarred by the pandemic in the other two scenarios, by 3 and 6 per cent respectively. All three assume a smooth transition to a free-trade agreement with the EU in the new year. But we also describe an alternative scenario in which the Brexit negotiations end without a deal. This would further reduce output by 2 per cent initially and by 1½ per cent at the forecast horizon.
Chart 1.2: Real GDP: central forecast and alternative scenarios
The same uncertainty clouds the fiscal outlook. Our virus scenarios suggest the deficit this year will peak at between £353 and £440 billion (17 to 22 per cent of GDP). Depending on the damage to potential output in the medium term, the deficit settles at between 1.7 and 6.1 per cent of GDP by the forecast horizon in 2025-26. Public debt (excluding the uneven effects of Bank of England schemes) continues to rise as a share of GDP over the next five years in all but the upside scenario.
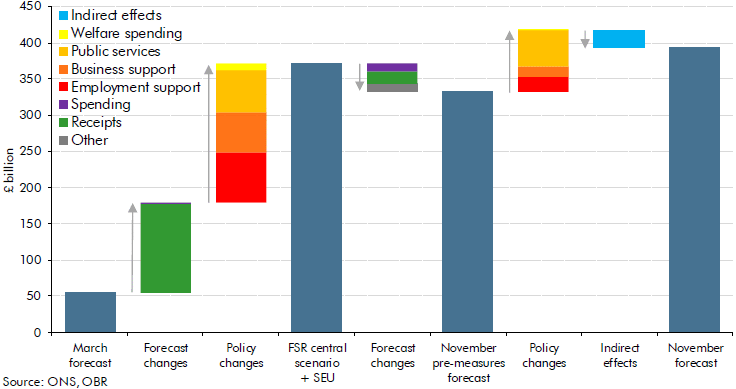
Unlike in previous recessions, the greater portion of the fiscal cost of the virus arises from the Government’s discretionary policy response rather than the hit to the economy caused by the virus. Of the £339 billion upward revision to borrowing between our March and November central forecasts, roughly three quarters is due to policy measures (in particular additional spending on the health service and the furlough scheme) and the rest is due to lower economic activity (mostly due to lower tax receipts) (Chart 1.3). Moreover, the connection between the public health restrictions and the levels of support offered to workers and businesses underscores the importance of controlling the virus to containing the longer-run cost of the pandemic.
Chart 1.3: Change in net borrowing in 2020-21
Under our central forecast, the pandemic leaves the public finances in a weaker position in the medium term and significantly adrift from any definition of balance contained in previous fiscal frameworks. Headline borrowing remains close to 4 per cent of GDP and the current budget remains in deficit by 1 per cent of GDP by the end of the forecast, missing the Government’s Budget 2020 target to balance it by 2023-24. The Government meets the other two targets included in its manifesto: net investment remains below 3 per cent of GDP on average and the ratio of debt interest spending to revenue reaches a new historical low of 1.7 per cent on the back of further falls in interest rates. The latter reflects investors’ continuing trust in the safety of UK government debt, as well as the support provided by the Bank of England’s gilt purchases in pursuit of its inflation target. But that trust rests on investors’ confidence that responsible fiscal and monetary policies will be maintained. So long as these conditions hold, a debt-to-GDP ratio over 100 per cent should not prove particularly onerous by historical standards.
The increase in borrowing does, however, render the public finances more vulnerable to changes in financing conditions and other future shocks. This heightened vulnerability is compounded by the shortening of the effective maturity of that debt as a result of both a greater focus on short-term debt issuance by the Treasury and further Bank of England purchases of longer-dated gilts financed through the creation of floating rate reserves. Taken together, these leave debt interest spending twice as sensitive to changes in short-term interest rates than prior to the pandemic. Arresting the continued rise in public debt is likely to require some fiscal adjustment once the virus has run its course. Only in our upside scenario, in which the pandemic is swiftly ended and there is little lasting damage to activity, does borrowing fall below the level required to stabilise the debt-to-GDP ratio by the forecast horizon. In our central forecast and downside scenario, tax rises or spending cuts of between £21 billion and £46 billion (between 0.8 and 1.8 per cent of GDP) would be required merely to stop debt rising relative to GDP.
The announcements made on 8 July were made too late for us to incorporate in the Fiscal sustainability report’s analysis but we have made an initial assessment of the fiscal and economic impacts in our press notice.
The coronavirus outbreak and the public health measures taken to contain it have delivered one of the largest ever shocks to the UK economy and public finances. Assessing fiscal sustainability in this context is challenging – it is difficult to predict what might happen from one month to the next, so projecting the fiscal position decades into the future might seem futile. But the pandemic has not displaced the long-term pressures that we typically focus on in our Fiscal sustainability reports (FSRs), although it has significantly changed the baseline against which their impact will be felt. To capture those changes, this FSR presents three potential scenarios (‘upside’, ‘central’ and ‘downside’) for the economy and the public finances over the medium term, assesses their implications for fiscal sustainability, and discusses how the pandemic and policy response has altered our assessment of fiscal risks.
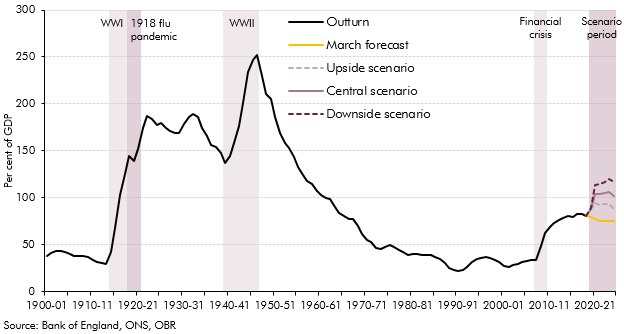
The UK is on track to record the largest decline in annual GDP for 300 years, with output falling by more than 10 per cent in 2020 in all three scenarios (and contracting by a quarter between February and April). This delivers an unprecedented peacetime rise in borrowing this year to between 13 and 21 per cent of GDP, lifting debt above 100 per cent of GDP in all but the upside scenario. As the economy recovers, the budget deficit falls back. But public debt remains elevated, continuing to rise in the central and downside scenarios.
1.Public sector net debt: coronavirus scenarios versus March forecast
That said, the outlook would have been much worse without the measures the Government has taken. These have provided additional financial support to individuals and businesses through the lockdown. They should also help to limit any long-term economic ‘scarring’, by keeping workers attached to firms and helping otherwise viable firms stay in business.
Our upside scenario assumes that long-term scarring is avoided, but in the central and downside scenarios it reduces output in the medium term by 3 and 6 per cent respectively. By 2024-25 the budget deficit falls back to close to our March forecast of 2.2 per cent of GDP in the upside scenario, but it remains higher – at 4.6 and 6.8 per cent – in our central and downside scenarios. This would represent structural fiscal damage of 2.4 and 4.7 per cent of GDP relative to our March forecast. None of the scenarios assume persistently lower growth in potential GDP, as was the case after the financial crisis and which would result in the loss of output and fiscal damage increasing over time. And they all assume that very low interest rates persist in line with market pricing, cushioning the fiscal blow. This helps stabilise public debt as a share of GDP after it has risen to a six-decade high.
The pandemic has hit the public finances at the end of two years during which fiscal policy has already been eased materially. This started in June 2018, when Prime Minister Theresa May announced a large NHS spending settlement, and was accelerated in Chancellor Rishi Sunak’s Spring Budget this year. In it, he set out plans to borrow significant sums on an ongoing basis and merely to stabilise, rather than reduce, the debt-to-GDP ratio.
A key risk to this pre-virus fiscal strategy was that the highly favourable financing conditions the Government currently enjoys might not persist. In that event, the longer-term pressures from health costs and demography we routinely highlight would need to be faced against the background of greater upward pressure on the ratio of debt to GDP. In the short term, the pandemic has seen borrowing costs fall even further, which all else equal increases the scope for running a fiscal deficit while keeping debt stable as a share of GDP. But higher public debt also increases the sensitivity of the public finances to higher interest rates, increasing the risks from pursuing a fiscal strategy that assumes that financing conditions will remain favourable over the longer term. And having experienced a public health crisis on this scale, there are also likely to be pressures to devote a higher share of GDP to spending on the NHS and wider care services in the future, including on adult social care.
In the short term, the Government understandably remains focused on controlling the virus and reviving the economy. Indeed, on 8 July, the Chancellor announced a further package of measures that the Treasury said would cost “up to £30 billion” this year, in addition to which a further £32.9 billion of departmental spending was also disclosed. But at some point, given the structural fiscal damage implied by our central and downside scenarios, the longer-term pressures on spending, and the range of fiscal risks we identify, it seems likely that there will be a need to raise tax revenues and/or reduce spending (as a share of national income) to put the public finances on a sustainable path.
The Chancellor’s latest measures were finalised and notified to us too late to be incorporated in our scenarios. They would have had a material effect had we been able to do so, but this would primarily affect the level of borrowing this year and the peak for public sector net debt, rather than the level of structural borrowing in the medium term.
The Government’s ability to push the deficit ever higher rests in part on the credibility of the institutional framework that gives investors confidence that the value of the government bonds they purchase will not be deliberately eroded in the future. Its willingness to push the deficit higher points to an increased reliance on the use of fiscal policy in ‘bad’ times, which implies that debt will also need to fall more quickly in ‘good’ times to build up fiscal space. But the case for precautionary investment in fiscal space in good times runs directly against the encouragement to run larger deficits created by the favourable financing conditions. These conflicting pressures will no doubt figure in the Chancellor’s deliberations as he designs the UK’s sixth set of fiscal rules in 10 years to guide his Autumn Budget and beyond.
In addition to its impact on public health and families’ wellbeing, the spread of the coronavirus will substantially raise public sector net borrowing and debt, primarily because of the associated economic disruption. The Government’s policy response will also have substantial direct budgetary costs, but the measures are designed specifically to support individuals and businesses through this temporary shock and so they should help prevent greater economic and fiscal damage in the long term. The immediate cost of the Government’s actions may be high, but we can be confident that the cost of inaction would ultimately have been much higher.
The OBR was created in 2010 to increase the transparency of the public finances and to provide independent analysis of the fiscal outlook and the uncertainties lying around it. During this unusual period, we will therefore try to bring together the latest evidence on how developments in the economy and asset markets and the Government’s policy measures will feed through to the official measures of the public finances and to prospects for fiscal sustainability more broadly. But it should be borne in mind that early vintages of the official statistics will also be more uncertain than usual and even mature ones may fail to capture the underlying reality as accurately as would normally be the case.
Evidence from past pandemics suggests that the economic impact of the coronavirus will arise much less from people falling ill or dying than from the public health restrictions and social distancing required to limit its spread. This will reduce demand for goods and services and the ability of businesses and public sector institutions to supply them. That means lower incomes, less spending and weaker asset prices, all of which reduce tax revenues, while job losses will raise public spending. The Government’s policy response incorporates increased public spending, tax cuts and holidays, and loans and loan guarantees – most of which are designed to support household incomes and to limit business failures and layoffs. The Bank of England has taken further measures that will provide some direct support for demand in the economy, but more importantly should help households, firms and the Government finance themselves, and thereby limit the lasting damage to the economy’s supply capacity.
The net effect of the coronavirus impact and the policy response is likely to be a sharp (but largely temporary) increase in government borrowing that will leave public sector net debt permanently higher as a share of GDP. However, the longer the period of economic disruption lasts, the more likely it is that the economy’s future potential output will be ‘scarred’ (thanks to business failures, cancelled investments and the unemployed becoming disconnected from the labour market). If that happens, the budget deficit would reverse less of its temporary rise as economic activity recovers, leaving the Government to confront a larger structural deficit and not just higher debt. Before the impact of the coronavirus became clear, the Government was content to run an ongoing deficit that would broadly stabilise the debt-to-GDP ratio over the medium term rather than reduce it – a judgement that it will no doubt re-visit in the wake of the current crisis.
We produced an initial assessment of the potential impact of the coronavirus on the economy and public finances on 14 April, which is available below. This was a scenario rather than a forecast, based on the illustrative assumption that people’s movements (and thus economic activity) would be heavily restricted for three months and would get back to normal over the subsequent three months. The main value of the scenario is to sketch out the channels along which the economic disruption might manifest itself and what that would mean for the public finances, and to provide a reference point against which to assess new developments as they occur. It included initial broad-brush estimates of the costs of various policy interventions.
Our rough judgement was that this would increase public sector borrowing this year by £218 billion relative to our March Budget forecast (to reach £273 billion or around 14 per cent of GDP). Once the crisis has passed and all the policy interventions have unwound, borrowing falls back relatively quickly to roughly the Budget forecast, but net debt would remain around £260 billion (10 per cent of GDP) higher by 2024-25. We indicate how the impact might vary if the restrictions were in place for longer or shorter periods – but there are huge uncertainties both around the impact on the economy and what that would mean for the public finances.
In order to monitor the impact of economic, market and policy developments against both the Budget 2020 forecast and this coronavirus reference scenario, we hope to build on our regular monthly commentary on the official public finances data to:
Look at the evolution of relevant economic and market indicators.
List the policy measures undertaken by the Government and explain what will determine their cost, how they will be reflected in the public finances data, and what has been assumed about them in our reference scenario.
Monitor the evolution of the public finances and the extent to which they are likely to provide a true reflection of the underlying economic and fiscal position.
Periodically update the reference scenario.
Once up and running, we will aim to update the monitoring information periodically to reflect new data, market developments and policy announcements (and we will tweet from @obr_uk when we are going to do so). But inevitably our ability to do this will depend on the availability of the appropriate staff at any given time.
We would be pleased to receive comments and questions to [email protected] on any of the analysis or commentary we publish to help us to refine it. If bodies producing their own estimates are happy to share their workings with us, that would be greatly appreciated too.
Coronavirus lockdown to deliver large (but hopefully temporary) shock to the economy and public finances
In addition to its impact on public health, the coronavirus outbreak will substantially raise public sector net borrowing and debt, primarily reflecting economic disruption. The Government’s policy response will also have substantial direct budgetary costs, but the measures should help limit the long-term damage to the economy and public finances – the costs of inaction would certainly have been higher. This note describes one illustrative economic scenario and its consequences for the public finances.
Deficit: Reference scenario versus Budget forecast
Key assumptions and results
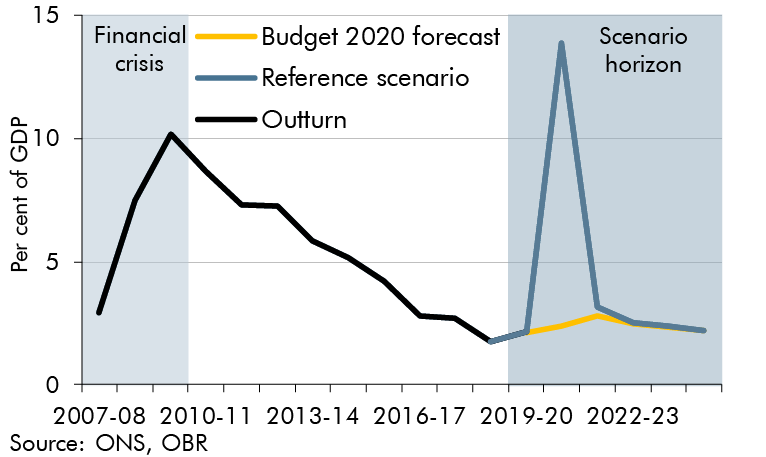
We do not attempt to predict how long the economic lockdown will last – that is a matter for the Government, informed by medical advice. But, to illustrate some of the potential fiscal effects, we assume a three-month lockdown due to public health restrictions followed by another three-month period when they are partially lifted. For now, we assume no lasting economic hit.
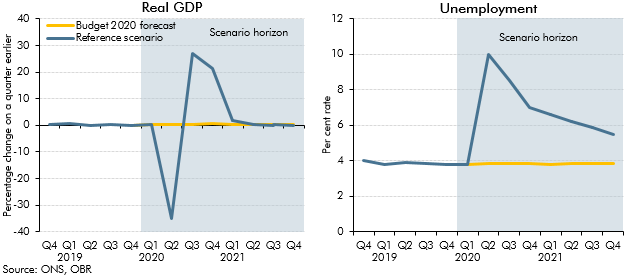
Real GDP falls 35 per cent in the second quarter, but bounces back quickly. Unemployment rises by more than 2 million to 10 per cent in the second quarter, but then declines more slowly than GDP recovers. Policy measures support households and companies’ finances through the shock.
Public sector net borrowing increases by £218 billion in 2020-21 relative to our March Budget forecast (to reach £273 billion or 14 per cent of GDP), before falling back close to forecast in the medium term. That would be the largest single-year deficit since the Second World War.
The sharp rise in borrowing this year largely reflects the impact of economic disruption on receipts (with smaller effects from policy measures like the business rates holidays) and policy measures that add to public spending (with smaller effects from higher unemployment).
Public sector net debt rises sharply in 2020-21 thanks to lower GDP, higher borrowing and the accounting consequences of the Bank of England’s policy measures. It surpasses 100 per cent of GDP during the year, but ends it at 95 per cent (versus 77 per cent in the Budget forecast) as the economy recovers. It remains 10 per cent of GDP above the Budget forecast in 2024-25.
Introduction
1.This note provides an initial exploration of the possible impact of the coronavirus outbreak on the public finances. There are few relevant precedents to inform any assessment of the outlook, which will in any case depend on how successful the public health measures are in containing the outbreak. So this note should not be viewed as a central forecast of what is most likely to happen. It is instead an illustrative scenario, based on particular assumptions regarding the duration of the measures and their economic impact, that shines a light on the channels through which the economic disruption and the Government’s policy response are likely to affect the public finances. The duration and scale of the economic disruption are both highly uncertain, but most – not all – the fiscal effects described here are broadly scalable and provide a starting point for estimating outcomes under alternative scenarios.
1.To construct the scenario, we have made the following underlying assumptions:
Public health measures result in a large share of economic activity ceasing for three months, with the restrictions on people’s movement and activity assumed to be lifted progressively over the subsequent three months. (But this should not be taken to imply that this is or should be Government policy.) This is the main driver of a sharp fall in GDP. For simplicity, the hit from the full lockdown is assumed to take place entirely in the second quarter of 2020 rather than falling partly in March (as in practice). For now, we have not assumed the shock has lasting economic consequences.
Fiscal and monetary support measures offset little of the loss in GDP, but they do mean that the associated loss in total hours worked is concentrated in average hours per worker rather than lower employment and also that private sector incomes fall by less than private sector output and expenditure. They will also help to limit the adverse impact on potential output and thus future GDP once the crisis has passed.
The consequences for the budget deficit and public debt have been estimated using our established ready reckoners, adjusted where necessary to capture distinctive features of this particular shock. We have also incorporated ballpark estimates of the effects of the authorities’ fiscal and monetary policy measures.
1.We have characterised this exercise as a ‘reference’ scenario for two main reasons. First, we intend to use it as a reference point against which to monitor incoming data and other information. Second, the economic scenario plays a similar role in providing a baseline against which to cost the Government’s policy response. (Our Budget forecast published on 11 March is clearly no longer relevant for either purpose.) But, as noted, the scenario should not be taken as our view of the most likely path for the economy and public finances. We are not yet in a position to form any such judgement, as we have no basis for knowing how long the most stringent public health measures will remain in place. By the same token, this should not be seen as a scenario around which risks are evenly balanced – the standard criterion that we use for describing our forecasts as ‘central’. Again, we are not yet in a position to form a judgement regarding the risks to either side of the scenario.
1.As discussed below, we compare the outlook for the economy and the public finances under this scenario with that in our March Budget forecast. This shows a significant budgetary hit both from the economic disruption and the direct cost of policy measures. But it should be borne in mind that the short- and medium-term outlook for the economy and the public finances would be very much worse without any fiscal and monetary response. The policy actions that have been implemented will directly help to support the incomes of individuals and businesses while the public health restrictions are in place, as well as improving the availability of finance. They should also help to limit any long-term economic ‘scarring’ – for example, due to cancelled business investment, widespread business failures and the unemployed losing contact with the labour market. Such scarring would both harm future living standards and increase the structural budget deficit.
1.Clearly, many other scenarios are possible. For now, we have confined ourselves to presenting simple ready-reckoners showing the possible implications for the public finances if the duration of the restrictions were longer or shorter. It is quite possible that at some duration the marginal economic and fiscal consequences of the public health measures may change, but at this stage we cannot say either when, or how significant, that might be.
1.We have focused on the short-term effects of the crisis in this note, but the medium-term consequences will be important too. Public debt will be higher over the medium term than in pre-coronavirus forecasts. But what matters for fiscal sustainability is what happens to the structural primary (i.e. non-interest) budget deficit. If the policy measures that have been implemented are successful in keeping businesses (and their employees) afloat until economic normality returns, then the structural primary deficit might be expected to return to something close to pre-crisis expectations. That said, if debt-servicing costs turn out to be higher – which could be the case, depending on what happens to interest rates – then the primary deficit would need to be smaller than previously thought sustainable. Of greater consequence would be the impact of any longer-term economic scarring on the public finances; the longer the economic disruption lasts, the greater such effects are likely to be.
1.The views expressed in this note are those of the OBR’s independent Budget Responsibility Committee, but we are very grateful to our own staff and to those of other departments for their input and hard work under very difficult circumstances. We have benefited from very constructive engagement with Treasury officials and the Chairman of the OBR discussed the findings of the analysis with the Chancellor of the Exchequer by phone on 7 April.
Context
Evidence from previous flu pandemics
1.To calibrate some of our assumptions we have drawn on the Resolution Foundation’s survey of evidence from previous pandemics.[1] The key insight is that most (perhaps 80 to 90 per cent) of the short-term economic impact comes not from people falling ill, but rather from the disruption to economic activity associated with the public health restrictions and social distancing required to control the spread of the disease. Of course, the reason why most of the short-term economic impact comes from these measures is that they are successful in limiting the spread of the disease. If the measures were not stringent enough to control the disease, then the economic impact from illness would be that much greater.
1.The differences between the effects on output of Spanish Flu, SARS and Ebola arose less from differences in the severity of the disease (measured in either infection or mortality rates) and more from differences in the severity of the measures taken to contain the disease and the response of citizens to the perceived risks. In 2008, the World Bank published a simulation of the potential economic impact of a pandemic flu similar to Spanish Flu, but with a SARS-type public health and societal response.[2] It concluded that just 12 per cent of the total economic costs were likely to arise from higher mortality, while 28 per cent came from higher levels of worker illness and absenteeism, and 60 per cent as a result of voluntary or mandatory efforts by people to avoid infection. Given the relatively low mortality rate from coronavirus, one would therefore expect the bulk of the economic effects to stem from the public health measures taken to contain the outbreak.
1.As the Resolution Foundation notes, coronavirus-related public health restrictions have been swifter, stricter, and more widespread than in response to any previous epidemic. It argued that annual output losses should therefore be at least as big as the high single or double-digit peak losses seen during Spanish Flu and Ebola rather than the much smaller ½ to 1 per cent losses in annual GDP experienced following the SARS outbreak.
External estimates of the economic impact of this outbreak
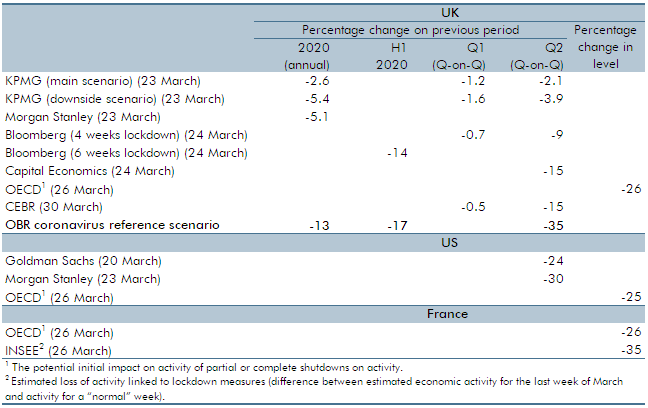
1.There is an increasing number of external estimates of the potential impact of the outbreak on UK GDP. The most recent, which are more likely to reflect the latest restrictions on economic activity, point to double-digit falls in GDP – consistent with our reference scenario. But, not surprisingly, the range of estimates is large (Table 1.1). The French statistical institute, INSEE, has estimated that the similar restrictions in place in France are likely to reduce economic activity there by around 35 per cent.[3] Similarly, the President of the Federal Reserve Bank of St Louis produced a ‘rough initial estimate’ that US real GDP might fall by up to 50 per cent during the period of full economic lockdown,[4] while his staff have published a ‘back-of-the-envelope’ estimate that the US unemployment rate could rise from 3½ per cent in February to 32 per cent by June.[5]
Table 1.1: Selected external estimates of GDP impact of coronavirus
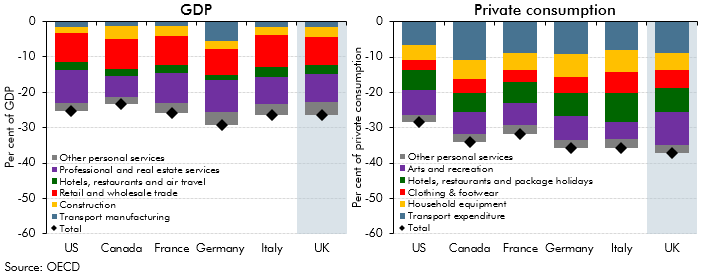
1.The OECD has provided estimates of the initial impact of coronavirus containment measures on GDP and household consumption for six major advanced economies (including the UK), calculated by aggregating the conjectured impact on individual sectors and expenditure categories. On average, they suggest that output could fall by around a quarter and that consumer spending could fall by a third, with the corresponding figures for the UK being 26 per cent and 37 per cent respectively (Chart 1.1).[6]
Chart 1.1 OECD estimates of initial GDP and private consumption losses
Recent UK economic indicators
1.The latest UK data have already turned sharply downwards. The UK composite purchasing managers’ index (PMI) came in at a record low of 36.0 in March, down from 53.0 in February. This is estimated to be consistent with GDP falling at a quarterly rate of 1½ to 2 per cent. However, the data were collected between 12 and 27 March, so largely before the latest restrictions were imposed. A British Chambers of Commerce survey found that revenues had fallen for around 75 per cent of firms in the week to the 27 March.
1.The Office for National Statistics (ONS) has launched a new business survey to assess the impact of the coronavirus outbreak. The first results – for the period from 9 March to 22 March (before the Government imposed limitations on people’s movements and ordered the closure of schools and non-essential shops) – showed almost half of firms reporting lower than expected turnover, while a quarter had already reduced staffing levels.[7] The SMMT reported that new car registrations in March fell 44 per cent on a year earlier, but that even more dramatic falls were witnessed in Italy (85 per cent), France (72 per cent) and Spain (69 per cent), where full economic lockdowns were imposed earlier than in the UK.[8]
1.The surveys will no doubt fall further – the collapse in the Italian services PMI to just 17.4 in March may be a foretaste of what is to come. But interpreting them is likely to be difficult, because they are based on the proportion of firms reporting falling output, not the extent to which output is falling in each firm. It will be especially difficult to capture the experience of firms where output has fallen to zero. Consequently, applying historical metrics may give misleading results when many businesses have suffered very large falls in activity.
1.DWP has reported that 950,000 new claims for universal credit were made between 16 and 31 March, suggesting that a sharp rise in unemployment has already taken place (although some of these claims will also relate to people experiencing a temporary drop in income without having lost their job or closed their business).
Economic scenario
1.We have constructed the economic side of our reference scenario by assessing the possible impact of the public health measures on output in each sector of the economy and then cross-checking this against an assessment of the possible impact on the expenditure components of demand. To a first approximation, the fall in output is determined by the assumed reduction in labour supply in each sector. Consistent with the World Bank simulations, we assume that the public health restrictions are responsible for around 90 per cent of the hit, rather than the direct effects from contracting the virus. So the depth and duration of the fall in GDP is very largely determined by the length and coverage of these restrictions (which will, of course, be influenced heavily by the progress of the disease itself).
Real GDP
1.To calibrate the economic impact of the health measures, we have:
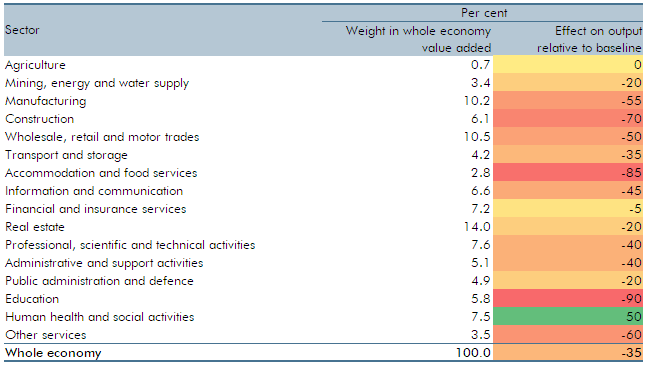
Estimated the share of output that would be lost in each industry in the second quarter of 2020, utilising estimates of the shares of key workers[9] and those able to work from home in each industry, with further adjustments for childcare responsibilities and absences due to illness. Those output losses are partly offset by increases in output in a few industries (in particular healthcare providers and food retailers). We have tried to incorporate several relevant factors, but this is necessarily somewhat broad-brush. The results are shown in Table 1.2. As more information and data become available, we will be able to revisit our calibration of the reference scenario.
Assumed that the effect on output reduces proportionately as restrictions are eased. Specifically, we have assumed their impact is halved in the third quarter, and activity returns to pre-outbreak levels in the fourth quarter (so the scenario assumes that it is not necessary to reimpose the restrictions to deal with a new outbreak in the autumn). Some longer-term economic ‘scarring’ is of course possible, even if restrictions are not reintroduced, but we have not attempted to quantify such effects.
Table 1.2: Output losses by sector in the second quarter of 2020
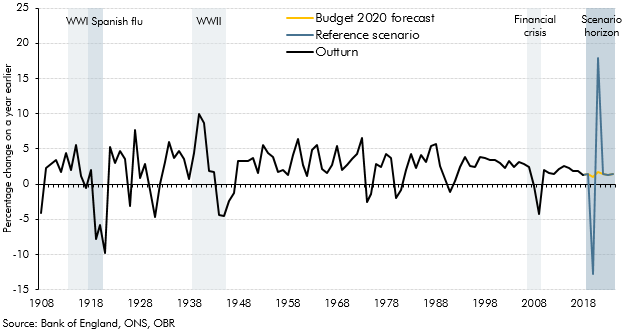
1.These assumptions imply a drop in GDP of around 35 per cent in the second quarter – the same hit as INSEE’s initial estimate of the effect of similar measures in France. We have assumed that GDP regains its pre-virus level by the fourth quarter, with half the second-quarter fall unwinding in the third quarter. (Arithmetically, this means that GDP grows by around 25 per cent in the third quarter, and by around 20 per cent in the final quarter of 2020). The resulting 13 per cent fall in annual GDP in 2020 would comfortably exceed any of the annual falls around the end of each world war or in the financial crisis (Chart 1.2).
Chart 1.2: GDP decline in historical perspective
1.It would not require particularly large changes to the highly uncertain assumptions about prospects for individual sectors to alter the estimated fall in GDP significantly and it is quite plausible that the impact could be materially smaller or larger than in our reference scenario. However, for the purpose of evaluating the consequences of such outcomes, at least as a first approximation, one can scale the scenario. So, for instance, if one wished to assume a fall in GDP of 25 per cent rather than 35 per cent, in line with the recent OECD analysis, but were willing to keep other aspects of the scenario (such as the duration of the restrictions) unchanged, then other variables could in principle be scaled proportionately.
1.Since the GDP loss in effect hits immediately, this figuring in broad terms implies that each month of full economic lockdown reduces monthly output by 35 per cent (relative to a baseline with no restrictions) and therefore takes around 3 per cent off a full year’s real GDP (assuming the restrictions continue to be unwound over three months).[10] It is unlikely, of course, that these effects would be entirely linear, but that would seem a reasonable starting point for evaluating the economic consequences of a shorter or longer lockdown.
1.The ONS faces a huge challenge in capturing a sudden change in economic activity of this magnitude in its measures of GDP. So early estimates may be more liable to revision than usual and even mature ones may fail to capture the underlying reality as accurately as would normally be the case. It is also worth remembering that while we are trying here to evaluate the potential fiscal consequences of the crisis based on illustrative assumptions about its economic impact, the ONS’s mature outturn estimates of economic activity will in part be guided by fiscal outturns like recorded tax receipts.
1.One extension of this work would be to quantify potential long-term supply impacts that would lead to a more persistent effect on output. These would include the temporary period of lower investment permanently lowering the capital stock and productivity, as well as the consequence of significant numbers of business failures. To the extent that such effects emerge, they would compound any pressures on fiscal sustainability.
Labour market
1.The sharp fall in GDP is accompanied by a steep rise in the unemployment rate to 10 per cent in the second quarter, equivalent to an increase in unemployment of 2.1 million (to a total of 3.4 million). As with GDP, the rise in unemployment is likely to be very fast, as the sharp rise in new claims for UC already attests. Indeed, we might expect almost all the rise to happen within the first month. The precise level of unemployment consistent with a 35 per cent fall in GDP is of course hugely uncertain – and that is compounded by uncertainty over the extent to which the coronavirus job retention scheme (CJRS) and self-employed income support scheme (SEISS) will cushion the blow. We have assumed that these schemes result in more of the fall in output being reflected in average hours worked than in fewer heads employed. We have then assumed that the subsequent decline in unemployment lags the rebound in GDP, with the initial recovery concentrated in the recall of furloughed workers. Specifically, around a quarter of the rise in unemployment unwinds in each of the subsequent two quarters, with the rest coming through gradually thereafter (Chart 1.3).
Chart 1.3: Real GDP and unemployment: reference scenario versus Budget forecast
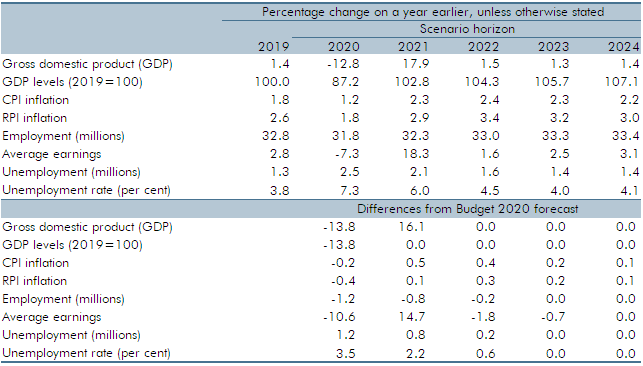
1.Table 1.3 summarises the results of the economic scenario.
Table 1.3: Key economic variables: reference scenario versus Budget forecast
Macroeconomic policy response
1.The policy response by the Government and the Bank of England is likely to have only a limited effect through the normal aggregate demand channels, as the fall in output is largely the by-product of the impact of the health measures on the supply of, and demand for, goods and services. In such circumstances, the impact of the policy response instead lies mainly in moderating the impact of the fall in output on private sector incomes and in preventing lasting damage to the economy’s supply capacity. Key actions include:
Monetary and financial policy. The Bank of England has made several interventions, including: lowering Bank Rate; additional gilt purchases; a reduction in the counter-cyclical capital buffer; the introduction of a new Term Funding Scheme focused on SMEs; and the introduction of a new Covid Corporate Financing Facility for larger firms. These should facilitate the flow of finance to households, businesses and the Government, and limit the adverse impact of the sharp near-term downturn on the economy’s longer-term supply capacity by reducing business failures and job losses.
Fiscal policy. The CJRS and SEISS are probably the most significant fiscal interventions, potentially underwriting a significant fraction of private sector employment earnings and thus supporting household incomes. Business rates holidays should also help many firms to cover other fixed costs. Other fiscal measures – such as the business interruption loan schemes – also help to limit business failures and job destruction.
1.The effect of the health and economic measures together is greatly to restrict consumption and production, but to limit the associated falls in income (especially of households). Private sector savings consequently rise, mirroring the large increase in public borrowing. Since all the UK’s trading partners have been afflicted by coronavirus, we assume there is no effect on the trade balance, though exports and imports are both likely to fall sharply.
Inflation
1.Despite the very sharp fall in GDP, we have assumed that the effect on inflation is modest, reflecting several conflicting forces:
The coronavirus shock reduces both demand and supply, but to varying degrees in different markets. Some markets will be in a state of (possibly considerable) excess supply, whereas others will be in a state of (possibly considerable) excess demand. Consequently, there will be downward pressure on some prices and upward pressure on others, but it is not at all clear which would dominate overall. Nor is it clear whether prices would respond to such changes in the way that is usually assumed given the nature of the disruption to economic activity. We have not therefore incorporated any adjustment for the pressure of demand on inflation.
While this is a global shock, sterling has also fallen significantly. This will increase import prices – although the pass-through to consumer prices is likely to be limited, and absorbed in firms’ margins, at least while the trading restrictions remain in place.
Oil prices have fallen sharply, which will lower petrol prices. This reduces inflation this year and raises it next year when we assume that they bounce back.
1.The net result of these effects is a temporary drop in CPI inflation to 0.7 per cent in the second quarter of 2020, followed by a rise to 2.7 per cent a year later, which eases back slowly towards the Bank of England’s 2 per cent target by the scenario horizon. RPI inflation is also affected by lower mortgage interest payments and lower house prices.
Financial market assumptions
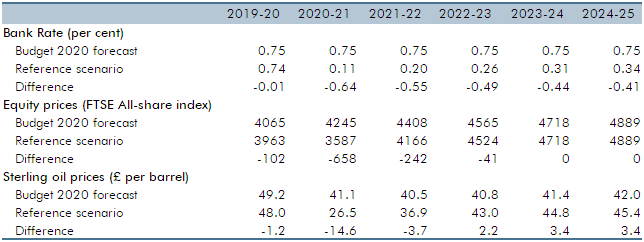
1.As in our Economic and fiscal outlook (EFO) forecasts, for the reference scenario we need to make several conditioning assumptions about financial market variables. These are largely drawn from the position in markets as of 31 March, plus assumptions about how far and how fast they will return to previously assumed levels, if at all (Table 1.4). Specifically:
Bank Rate. The market curve returns to 0.25 per cent during 2022-23 and remains well below our March forecast assumption throughout the next five years.
Equity prices are around 15 per cent lower in 2020-21 than assumed in our March forecast, but return to the March forecast level over the following two years.
The sterling oil price falls to £27 a barrel in 2020-21 (assuming it recovers from its current level through the year) compared to £41 a barrel in our March forecast.
1.The fiscal implications of the scenario sketched out above will reflect both the fiscal consequences of the fall in activity and the costs of the policy measures being undertaken. Our standard approach to quantifying such effects is to consider what would happen to the economy absent any policy measures, then add on the direct cost of measures, and finally incorporate any indirect effects on the public finances from their general economic impact. That approach is unlikely to be fruitful in present circumstances, given the difficulty of identifying what would have happened to economic activity had there been no policy response at all. So instead we simply compare the fiscal outturns under the scenario with the fiscal forecast that we published alongside the Chancellor’s Budget on 11 March.
1.For simplicity, and in line with our economic assumptions, we have assumed that the implications for the public finances start to be felt from the beginning of 2020-21, whereas clearly in some areas receipts and spending in 2019-20 will already have been affected.
1.The fiscal scenario results have been compiled using the established ready-reckoners that underpin our Fiscal risks report stress tests and our EFO scenarios, with a handful of adjustments to capture distinctive features of the current setting. There is of course enormous uncertainty around these estimates, both in respect of the economic scenario itself and because ready-reckoners are more suitable for considering the effects of small departures from baseline assumptions rather than the large ones considered here. And there are several issues that we have not yet explored – for example, the effect on local authorities’ and public corporations’ finances and the costs associated with guarantees on business interruption loans. We will address these issues for future updates.
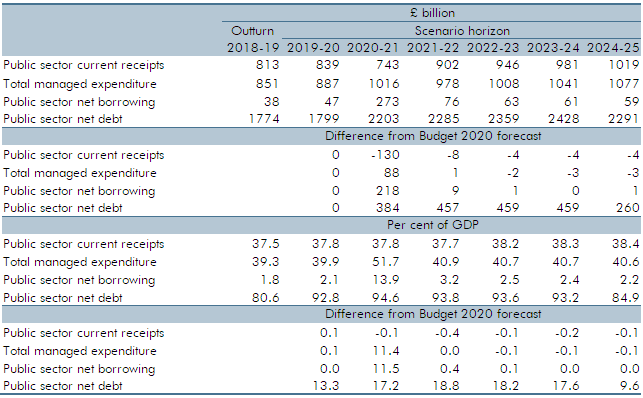
1.Table 1.5 reports the high-level results for receipts, spending, borrowing and debt (which should only be read as indicating the broad orders of magnitude involved):
Receipts in 2020-21 are £130 billion (15 per cent) lower than assumed in the Budget, falling 12 per cent relative to 2019-20. That compares with the 3.4 per cent fall between 2007-08 and 2009-10 as a result of the financial crisis and subsequent recession. Relative to GDP, the fall is more modest because receipts and GDP are both lower. Receipts rebound in 2021-22, returning to roughly the Budget forecast by 2024-25. In 2020-21, the hit is dominated by the consequences of the downturn. With all but the cost of business rates holidays broadly scalable with the duration of the shock, each additional month of full lockdown might add around a further £25 billion to the deficit, with a similar reduction for each month if the lockdown were to be shorter (assuming no change in the period over which the lockdown eases and ignoring within-year timing effects associated with deferred tax payments).
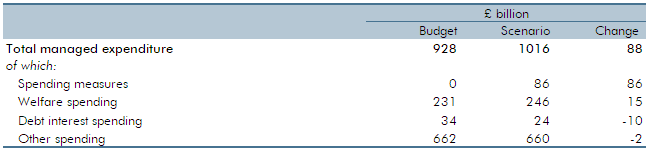
Spending in 2020-21 is £88 billion (9 per cent) higher than the Budget forecast, rising 15 per cent from 2019-20, matching the 15 per cent rise between 2007-08 and 2009-10. With spending up sharply and GDP down sharply, spending rises to 52 per cent of GDP – comfortably its highest since the Second World War. Spending also falls back in 2021-22 and returns to roughly the Budget forecast by 2024-25. The rise in 2020-21 is dominated by the cost of policy measures, with higher welfare spending largely offset by lower debt interest costs (despite much higher borrowing). If a material proportion of the policy costs were scalable with the period of disruption, each additional month of full lockdown might add a further £10 to £20 billion. But unlike receipts, this effect should not be pro-rated for shorter periods of lockdown since the cost of some policy measures would not be reduced in those circumstances.
Borrowing therefore rises to £273 billion (14 per cent of GDP) in 2020-21 – the highest deficit since the Second World War, and well above the financial crisis peak. That would be £218 billion higher than the Budget forecast, with policy measures accounting for £100 billion of the rise. The deficit falls back quickly in 2021-22 as temporary policy costs end and the economy recovers, returning to the Budget forecast thereafter. Each additional month of lockdown might add £35 billion to £45 billion to this figure, while each month less would reduce it by a somewhat smaller amount.
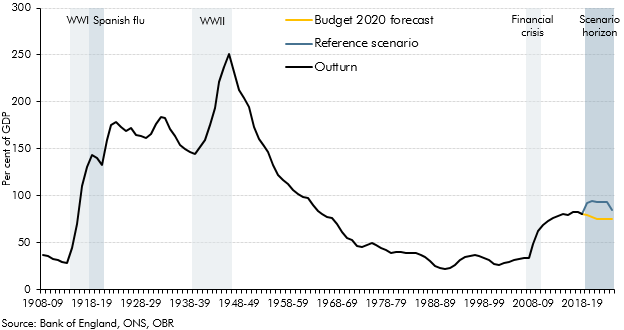
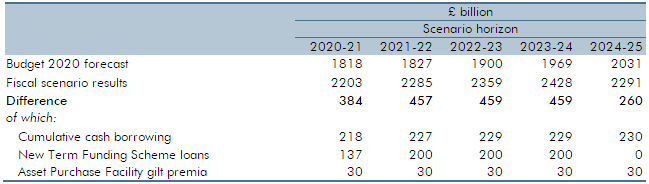
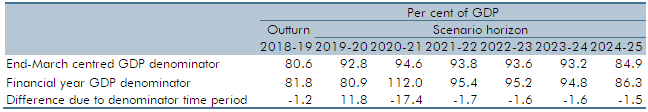
Debt rises sharply in 2020-21. Higher cash debt reflects higher borrowing, but also the Bank of England’s additional quantitative easing and the new Term Funding Scheme. Debt at the end of 2020-21 is £384 billion higher than the Budget forecast. GDP is also lower, but because the denominator in the debt-to-GDP ratio is – by ONS convention – the sum of nominal GDP over the four quarters straddling the end of the financial year, the sharp falls in GDP in the second and third quarters of 2020 affect the denominator in 2019-20 rather than 2020-21. With activity assumed to return to around its pre-crisis level by the fourth quarter of 2020, the denominator for debt at the end of 2020-21 is virtually unchanged from the Budget forecast. So, the increase in the debt-to-GDP ratio in 2020-21 is due to higher cash debt, taking it 17 per cent of GDP higher than predicted at the Budget to 95 per cent of GDP. (The scenario would be consistent with the debt-to-GDP ratio topping 100 per cent of GDP during 2020-21.) As the rise in the deficit is only temporary, absent Bank of England interventions, debt remains relatively stable beyond 2020-21, albeit at a higher level. This contrasts with the financial crisis, after which a large structural deficit persisted and debt continued to rise as a share of GDP until 2016-17. By 2024-25, net debt is 10 per cent of GDP above the Budget forecast. This result is, of course, particularly sensitive to the assumption that the economy returns swiftly to its pre-virus path rather than to a persistently lower one as a result of economic scarring.
Table 1.5: Key fiscal aggregates: reference scenario versus Budget forecast
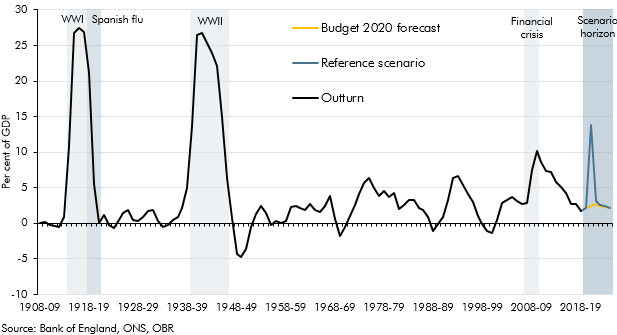
1.Charts 1.4 and 1.5 place the scenario results in the context of the paths for borrowing and debt since before the First World War, including the less discernible effects of Spanish flu.
Chart 1.4: Public sector net borrowing: reference scenario versus Budget forecast
Chart 1.5: .Public sector net debt: reference scenario versus Budget forecast
1.The following sections explain the figuring that underpins the results in Table 1.5, focusing particularly on the effects in 2020-21. We look first at how the cost of fiscal policy interventions has been estimated, before describing the ready-reckoned scenario results across the main receipts and spending lines.
1.It is important not to place undue weight on the precise estimates. We present them to the nearest billion pounds to ‘show our working’ and ensure that each line is consistent with the economic scenario and that they also sum appropriately. But that does not imply that the impact on any particular tax head or spending line can be estimated with such precision.
Policy costings
1.The standard approach in our forecasts is to evaluate the cost (or yield) from new policies against a pre-measures baseline. That is not feasible in the current circumstances. Instead, we present the costs relative to a scenario baseline that already (implicitly) captures the effect of policy interventions on economic activity. Given the urgency of the need to support the economy and the resulting pace at which the Treasury and other departments have been working to develop the necessary policies, we have not gone through our standard iterative scrutiny processes to generate policy costings. Instead, the costs assumed in the scenario draw on the Treasury’s published estimates for some measures and our own broad-brush estimates for those that have not been costed. Where possible we have cross-checked our estimates against those presented by other organisations. We have made assumptions about how new policies will be recorded in the public finances, but these too are subject to uncertainty until the ONS has decided how they should be recorded.
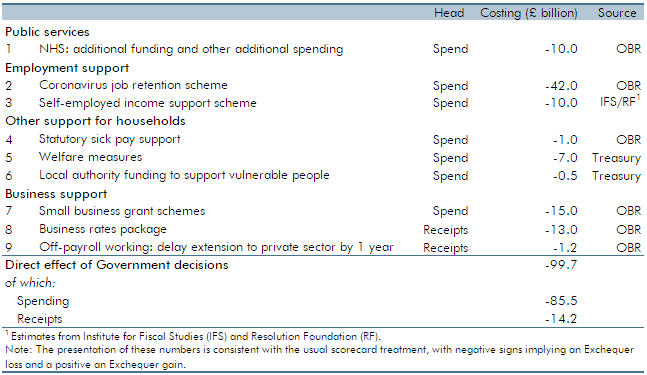
1.Table 1.6 presents all the costs that have been included in the reference scenario. At this stage, we have focused only on their costs in 2020-21, but we will need to consider what they imply for future years too. Notably, the grants paid to companies and the self-employed are taxable, so will affect tax receipts too (often with a lag). We will update these cost estimates as further measures are announced and as we refine existing estimates.
1.For 2020-21 we have assumed:
Additional DEL spending: the Chancellor announced on Budget day that the NHS would receive whatever extra resources it needed to cope with coronavirus. The initial estimate of this funding was up to £5 billion. There has been no official update on this figure, but it seems likely that it will have been exceeded by the cost of subsequent announcements – for example, the purchase of treatment of coronavirus patients at private hospitals. For the purposes of this scenario we have therefore simply doubled the Budget figure and included £10 billion in additional DEL spending. (On 13 April the Chancellor announced that this figure has in fact now reached £14½ billion – this came after we had closed the scenario, so it has not been incorporated.)
Coronavirus Job Retention Scheme (CJRS): the Government will pay employers a taxable grant worth 80 per cent of an employee’s wage cost, up to £2,500 a month, plus the associated employer NICs and the minimum auto-enrolment employer pension contribution on the subsidised wage. The scheme is open to all UK employers for a minimum of three months. Its cost will be determined by the number of employees whose jobs are furloughed and for how long, plus the level of the wage subsidy. The first two elements are subject to the same enormous uncertainties as the economic scenario. The latter is bounded by the eligibility criteria of the scheme. We have tried to estimate a cost that is consistent with the assumptions underpinning the economic scenario. Doing so implies that around 30 per cent of employees will be covered at a cost of £42 billion (equivalent to almost 15 per cent of total employee compensation in the baseline).[11] We estimate that around a fifth of that returns to the Exchequer in income tax and NICs – an effect that is captured implicitly via the fiscal ready-reckoning rather than explicitly here. The first payments are expected this month.
Self-employed income support scheme: the Government will provide a taxable grant to self-employed individuals and members of partnerships. The grant will be worth 80 per cent of average monthly profits in 2016-17, 2017-18 and 2018-19, again up to £2,500 a month, and will initially operate for three months. Eligibility requires that trading profits do not exceed £50,000 and that more than half of recipients’ total income is derived from self-employment. The grant is expected to be paid from June onwards. Its cost is dependent on the same factors as the CJRS, and with the same underlying uncertainties, plus an additional concern the Government has raised around the potential for fraudulent claims. We have yet to estimate the cost of this measure, but external analysis suggests a three-month cost of around £10 billion.[12]
Statutory sick pay (SSP) support: individuals self-isolating or unable to work as a result of coronavirus are now able to access SSP from their first day off. Employers with fewer than 250 employees will be able to reclaim up to two weeks’ SSP costs for any employee who has claimed it as a result of coronavirus. The Treasury estimated in the Budget that this could cost £2 billion, but as that estimate preceded the subsequent announcement of the more generous CJRS, we have used a figure of half that amount.
Welfare measures: the Government has announced a £20 a week increase in the standard allowance of universal credit and the basic element of working tax credits, plus several other changes to employment and support allowance, disability benefits and means-tested support for renters and the self-employed. The Treasury has estimated the cost of these measures at £7 billion in 2020-21.
Local authority funding to support vulnerable people: this £0.5 billion of new grant funding for local authorities in England was announced on Budget day.
Small business grant schemes: businesses will receive grant funding of either £10,000 or £25,000 depending on the rateable value of their properties. Based on the amounts already transferred to English local authorities for this scheme, plus Barnett consequentials for the devolved administrations, we estimate this will cost around £15 billion in 2020-21. The grants will apply to approximately 1 million properties.
Business rates package: the Government has announced a 12-month business rates holiday for all retail, hospitality, leisure and nursery businesses. Our initial estimate is that this will cost around £13 billion in 2020-21.
Off-payroll working: the Government announced on 18 March that it would delay implementation of reforms to off-payroll working rules for the private sector by a year to 6 April 2021. Our Budget forecast assumed this measure would yield £1.2 billion in 2020-21, so for now we have simply assumed that delaying it will cost the same.
Table 1.6: Policy cost estimates in 2020-21 under the reference scenario
Other measures
1.There are several measures that we have not estimated costs for yet. These include:
Coronavirus business interruption loan scheme and the Covid Corporate Financing Facility: the business interruption loan scheme was announced as up to £330 billion of support for businesses. These loans will be provided by commercial lenders, with 80 per cent of the loan guaranteed by the Government. To the extent that borrowers default on these loans and lenders call the guarantees, this will add to public spending. In addition, the Government will pay interest and any lender-levied fees for the first 12 months. There is considerable uncertainty around take-up and the share of loans that default. We have not estimated the potential cost of this scheme yet. The Covid Corporate Financing Facility will purchase commercial paper from firms experiencing severe disruptions to cashflows. It is unclear how this will be recorded in the public finances and therefore whether it will affect borrowing.
Tax deferrals and use of the time-to-pay service: VAT payments due between 20 March and 30 June 2020 can be deferred until 31 March 2021. Income tax self-assessment payments due on 31 July 2020 can also be deferred until January 2021. As payments remain due during the 2020-21 financial year, we have not included an impact on receipts for these deferrals yet, but it is likely that not all payments will be received due to business failures in the intervening period. We will consider how best to capture such effects in the scenario and update it as necessary. The Government also announced scaling up of the time-to-pay service, which could shift receipts between years and is subject to the same uncertainties over any costs due to business failures.
Suspension of rail franchise agreements: these have been suspended for the next six months. We have not yet estimated the impact that this will have on borrowing.
Exemptions from import duties on medical products: NHS suppliers will be exempted from paying customs duty and import VAT on specific medical items from outside the EU. The cost will depend on the volume of imports of these products.
Receipts
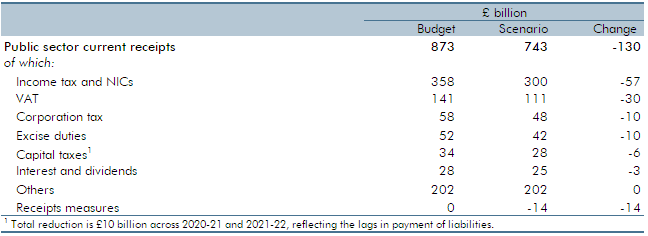
1.Receipts are 15 per cent below the Budget forecast in 2020-21 (Table 1.7). In particular:
Policy measures lower receipts by £14 billion. This is dominated by the cost of business rates holidays and the extension of other business rates reliefs.
Income tax and NICs are down 16 per cent, similar to the fall in annual GDP. Typically, income tax and NICs would be expected to fall more than GDP owing to fiscal drag, but support to wages and salaries from the CJRS and to self-employment income from the SEISS tempers the effect. As noted, deferred self-assessment tax payments are for now all assumed to be recouped in-year. We have not yet considered second-order effects such as the lower path for interest rates reducing savings income or rent holidays reducing property income. Nor have we considered the effect of cashflow problems at firms leading to PAYE liabilities not being paid over to HMRC, which could be material given the likely extent of such problems.
VAT and excise duties are down 21 per cent. They fall more than total receipts and GDP, reflecting lower consumer expenditure, which we assume will be concentrated in standard-rated goods and those liable to excise duties, plus increases in VAT debt (as we saw in the financial crisis). Air passenger duty receipts are hit particularly hard.
Corporation tax receipts are down 18 per cent thanks to lower profits and lower oil prices. One lesson from the financial crisis was that losses can cast a long shadow on future receipts. With loss restriction measures now in place, the depressing effect from the use of past losses to offset future profits should be smaller but longer-lasting. We have not modelled that effect for this scenario given the complexity of doing so.
Capital taxes are down 28 per cent thanks to the sharp falls in equity prices and property transactions (including the effect on 2020-21 capital gains tax liabilities that will largely be paid in 2021-22 due to the self-assessment payment lag). The fall is greater than the fall in GDP, echoing what happened during the financial crisis.
Interest and dividend receipts are down by 9 per cent reflecting lower interest rates and the fact that RBS (like other banks) will not be paying dividends this year.
Table 1.7: Receipts in 2020-21: reference scenario versus Budget forecast
Spending
1.Spending is 9 per cent above the Budget forecast in 2020-21 (Table 1.8). That reflects:
Policy measures adding £86 billion in 2020-21. As shown in Table 1.6, the largest element is the assumed £42 billion cost of the CJRS (gross of its effects on tax receipts). Grants to small firms cost £15 billion, while additional DEL spending (for the NHS and other things) and the SEISS each add a further £10 billion.
Welfare spending rising by 6 per cent, excluding measures, thanks to the 1.4 million rise in unemployment on average over the year, plus the effect of lower earnings. We assume all the extra unemployed will claim out-of-work benefits. Adding the cost of measures, welfare spending is 10 per cent higher than in the Budget forecast.
Departmental capital budgets being underspent by £2 billion more than we assumed in the Budget. This is an illustrative 50 per cent increase to our Budget assumption, to reflect some capital projects being postponed due to the public health measures, and less than the full spending shortfall being made up during the remainder of the year.
Debt interest is 30 per cent lower, despite the central government financing requirement increasing by around £220 billion. That reflects lower Bank Rate (which increases the saving associated with the £435 billion of gilts that were already in the APF pre-coronavirus) and the £200 billion of additional quantitative easing (which, in effect, refinances £200 billion of gilts at Bank Rate). Lower gilt yields and lower RPI inflation also reduce spending in 2020-21 relative to the Budget forecast. Only the additional financing from the scenario adds to debt interest, but with gilt yields so low that generates only a modest offset. While debt interest is lower in this scenario than in the Budget forecast, the sensitivity of spending and the deficit to increases in Bank Rate is further increased. Once quantitative easing has been fully unwound – which could be far into the future – higher debt would be expected to increase debt servicing costs.
Table 1.8: Public spending in 2020-21: reference scenario versus Budget forecast
Public sector net debt
1.With the scenario assuming only a temporary hit to GDP, its effect on the debt-to-GDP ratio is largely determined by what happens to the cash value of debt. This rises sharply in 2020-21, reflecting the higher deficit and monetary policy measures. The combined addition relative to the Budget forecast approaches £½ trillion between 2021-22 and 2023-24. It then falls back in 2024-25 as loans issued by the Bank of England are repaid (Table 1.9).
1.These effects fall into three main categories:
Financing the higher budget deficit adds increasingly to debt in each year. This is more than explained by higher primary borrowing, with debt interest spending lower.
Financing the Term Funding Scheme for SMEs adds £200 billion to debt before the loans are repaid in 2024-25. We assume that banks move their existing TFS loans into the new scheme in 2020-21 as it costs less, so it takes two years for the full £200 billion to feed through to the level of debt. (As with the existing TFS, this addition to debt reflects the fact that the loans are not deemed liquid and so do not net off debt. It does not reflect the likelihood of debt actually rising by this amount due to loans not being repaid, which is very low given the terms on which they are extended.)
Expanding gilt purchases under the Asset Purchase Facility increases debt to the extent that the market price of the purchases is higher than the nominal value of the gilts recorded in the public finances. We assume that the premium paid is similar to that on existing purchases, but that is uncertain given market volatility.
Table 1.9: Public sector net debt: reference scenario versus Budget forecast
1.By convention, the ONS calculates the debt-to-GDP ratio using an ‘end-March centred’ measure of GDP. This means that for the debt-to-GDP ratio in 2019-20, the March 2020 stock of debt is divided by the sum of nominal GDP in the four quarters from 2019Q4 to 2020Q3. As the shock to GDP in the scenario comes in the second quarter of 2020, it is reflected almost entirely in the denominator of the 2019-20 debt-to-GDP ratio rather than the 2020-21 ratio where the effect on cash debt first hits. As Table 1.10 shows, debt would rise to over 100 per cent of GDP in 2020-21 if the denominator were instead based on financial year GDP. Indeed, since the scenario assumes that the economic and fiscal hit is concentrated in the first half of 2020-21, this implies that debt will rise well above 100 per cent of GDP for a period this year, and only fall below that level again when GDP recovers.
Table 1.10: Debt-to-GDP ratios using different time periods for the denominator
Next steps
1.Resources permitting, we will continue to expand our scenario analysis and to refine the assumptions used in the reference scenario as new data become available and on the basis of feedback from stakeholders and discussions with forecasters across government.
1.A non-exhaustive list of things that we hope to consider includes:
Refining aspects of the reference economic scenario. For now, we have assumed no lasting economic hit, but this will need to be revisited. The fiscal implications of an economic shock also depend not just on its scale but also its composition. We have so far made only very broad-brush assumptions about how the expenditure and income composition of GDP will be affected. There would also be value in considering further how the output shock and the policy response will affect the labour market.
Refining the fiscal ready reckoners. We have largely relied on ready-reckoners drawn from individual tax and spending forecast models to derive the scenario results. Bottom-up modelling of this sort is inevitably somewhat partial, so we plan to look at top-down alternatives too. In addition, there are numerous areas where it will be possible to refine specific assumptions in individual taxes or spending lines following discussion with stakeholders. For example, we have not yet considered what the current crisis will mean for local authorities’ finances or whether any guarantees or other contingent liabilities will crystallise.
Testing the extent to which the fiscal implications of different economic scenarios can be scaled. Assuming effects to be scalable seems a reasonable starting point, but it seems unlikely that this would apply precisely or equally in all cases.
Refining policy costings in the reference scenario. As well as refining assumptions underpinning individual costings, we will consider how they interact with each other.
1.We would be pleased to receive feedback on any aspect of this scenario analysis or our planned next steps to [email protected].
Footnotes
1. Hughes, R., Safeguarding governments’ financial health during coronavirus: What can policymakers learn from past viral outbreaks? Resolution Foundation, March 2020.
2 Brahmbhatt, M. and Dutta, A., On SARS-type Economic Effects during Infectious Disease Outbreaks, Policy Research Working Paper 4466, World Bank, January 2008.
3 INSEE, Point de conjoncture, 26 March 2020.
4 Bullard, J., Expected U.S. Macroeconomic Performance during the Pandemic Adjustment Period, 23 March 2020.
5 Faria e Castro, M., Back-of-the-Envelope Estimates of Next Quarter’s Unemployment Rate, 24 March 2020.
6 OECD, Evaluating the initial impact of COVID-19 containment measures on economic activity, 26 March 2020.
7 ONS, Coronavirus, the UK economy and society, faster indicators, 2 April 2020.
8 SMMT, UK new car registrations fall -44.4% in March as coronavirus crisis hits market, 6 April 2020.
9 GOV.UK, Guidance for schools, childcare providers, colleges and local authorities in England on maintaining educational provision, 19 March 2020.
10 This is not the same as saying it takes a further 3 percentage points off annual GDP growth, since arithmetically it matters when in the year that happens – but that is, of course, second order.
11 Based on our March forecast of compensation of employees in the second quarter of 2020.
12 See Emmerson, C. and Stockton, I., The economic response to coronavirus will substantially increase government borrowing, Institute for Fiscal Studies, March 2020, and Bell, T. et al., Unprecedented support for employees’ wages last week has been followed up by equally significant, and even more generous, support for the self-employed. But gaps remain., Resolution Foundation, March 2020.
Given the enormous rise in the budget deficit in 2020-21, we took the exceptional step of presenting monthly profiles consistent with our scenarios to provide a reference point against which to monitor incoming data. Profiles for 2020-21 consistent with our initial reference scenario were published on 14 May 2020 and updated profiles consistent with the central scenario in our 2020 Fiscal sustainability report were published on 14 July 2020. On 21 August 2020, these were updated to incorporate the cost of measures announced by the Chancellor in his 8 July Summer Economic Update, then again on 22 December 2020 to bring it in line with the November 2020 Economic and fiscal outlook. These allowed us and users to get an idea of whether monthly outturn data were proving to be better or worse than assumed. We stressed that the profiles were relatively broad-brush and illustrative, and that there was considerable uncertainty around them. We continue to publish monthly profiles on the associated Economic and fiscal outlook pages.
In broad terms, the profiles were produced by using information known when the Economic and fiscal outlook (EFO) forecasts were put together (e.g. April to September/October outturns from the ONS). Profiles for the remainder of 2020-21 draw on historical monthly patterns of receipts and any known timing effects (e.g the timing of the tax deferral measures). Likewise on the spending side, the costs of the various policy measures were also apportioned as best we can. More information about the assumptions underpinning the full-year forecast can be found in Chapter 3 of our November 2020 EFO.
The Government’s economic policy response to the coronavirus crisis provides support for individuals and businesses through grants, loans and guarantees, as well as significant increases in public services spending. This will have substantial direct budgetary costs. But the measures are designed specifically to support the economy through this temporary shock and so they should help prevent greater economic and fiscal damage in the long term.
The database below provides our latest estimates of the costs of various policy interventions, including those incorporated in our 2020 Fiscal sustainability report plus initial estimates of the measures announced in the Chancellor’s Summer Economic Update on 8 July. Some estimates could be revised materially as further information on the design of particular interventions and the use of different schemes becomes available. But on this provisional basis, we estimate that direct impact of new policy measures on the budget deficit in 2020-21 to be £192.3 billion.
Previous editions of the policy monitoring database are also available below. These illustrate the potential for revision to some estimates as more information becomes available.
Every month the Office for National Statistics and the Treasury produce a joint statistical bulletin on the latest public finances data. On the same day we provide a brief analysis of the data, but in 2020-21 also we explained how it should be interpreted in light of the monthly profiles consistent with the coronavirus reference scenario that are available on this page.
Record budget deficit undershoots March 2021 forecast
The initial estimate of government borrowing for the 2020-21 fiscal year of £303.1 billion is roughly double the previous record set at the height of the financial crisis in 2009-10 (£157.7 billion). But it is £24.3 billion below our March forecast on a like-for-like basis (and £51.5 billion below it including loan write-offs that are not yet recorded in outturn). The surprise relative to our forecast is largely due to spending on pandemic-related programmes coming in below our downwardly revised forecast. Receipts were only modestly stronger than anticipated.
Record budget deficit could undershoot our latest forecast
Government borrowing remained high in February at £19.1 billion. With one month of the fiscal year remaining, borrowing has reached £278.8 billion. That far exceeds the previous annual record set at the height of the financial crisis in 2009-10 (£157.7 billion). But it looks set to undershoot our latest estimate for borrowing in 2020-21 (on a like-for-like basis with the published ONS data) of £327.4 billion, thanks to even greater underspending by government departments than our forecast assumes.
Sharp rise in budget deficit is slower than expected
Government borrowing continued to rise in January, with monthly borrowing of £8.8 billion, despite a better-than-expected £24 billion of tax payments being made through self-assessment. Year-to-date borrowing has reached £271 billion, far exceeding the pre-virus annual record set at the height of the financial crisis in 2009-10 (£158 billion). We will publish our latest estimate of borrowing for 2020-21 alongside the Budget on 3 March.
The pace of government borrowing picked up further in December to reach £34.1 billion, the highest monthly total since May. Year-to-date borrowing now stands at £270.8 billion, far exceeding the pre-virus annual record set at the peak of the financial crisis (£158 billion). The reimposition of a national lockdown in early January means prospects for the rest of the year remain highly uncertain.
The pace of government borrowing picked up again in November to reach £32 billion, the highest monthly total since May. Year-to-date borrowing now stands at £241 billion, far exceeding the pre-virus annual record set at the peak of the financial crisis (£158 billion). With a sharp resurgence in virus cases and the introduction of further health restrictions, prospects for the rest of the year remain highly uncertain.
Halfway through the 2020-21 fiscal year, cumulative borrowing has reached £208 billion, £51 billion above full-year borrowing in 2009-10 (at the peak of the financial crisis). Year-to-date borrowing is still lower than assumed in the central scenario from our Fiscal sustainability report, as both GDP and tax receipts have fared better than assumed. But with a resurgence in virus cases and the Chancellor announcing new support measures, prospects for the rest of the year remain highly uncertain.
Budget deficit reaches £174 billion in just five months
Less than halfway through the 2020-21 fiscal year, the budget deficit has already topped full-year borrowing in 2009-10 (at the peak of the financial crisis). Despite that, year-to-date borrowing is lower than assumed in the central scenario from our Fiscal sustainability report, as both GDP and tax receipts have fared less badly than assumed. With the virus taking hold again and the Chancellor announcing new support measures, prospects for the rest of the year remain highly uncertain.
Public sector net debt hits £2 trillion for the first time
The budget deficit rose sharply again in July, topping £150 billion for the year-to-date and pushing public sector net debt over £2 trillion for the first time. But year-to-date borrowing is lower than in our Fiscal sustainability report central scenario. That reflects lower departmental spending and loan guarantee write-off costs that have yet to be incorporated into outturn data, as well as surprisingly strong tax receipts.
Budget deficit reaches £128 billion in just three months
The budget deficit continues to rise sharply. Three months into the 2020-21 fiscal year, tax payments received by HMRC are down by 35 per cent on last year, while central government spending is up 40 per cent. But year-to-date borrowing is lower than assumed in the central scenario from our Fiscal sustainability report. That reflects lower departmental spending and loan guarantee write-off costs that are not yet incorporated in the outturn data, as well as surprisingly strong June tax receipts.
Budget deficit tops £100 billion in just two months
May’s public finances data continue to show the budget deficit rising sharply. Two months into 2020-21, tax payments received by HMRC are down 43 per cent on the same period last year, while central government spending is up 48 per cent. Relative to our April scenario, initial estimates of both GDP and tax receipts have fallen slightly less sharply than we assumed. Debt is estimated to have topped 100 per cent of GDP for the first time since the early 1960s.
Budget deficit leaps to £62 billion in April 2020 alone
April’s public finances data provide an initial taste of the fiscal hit from the coronavirus lockdown and Government support for individuals and businesses. Tax payments received by HMRC were down 42 per cent on the same month last year, while central government spending jumped 52 per cent. As a result, the budget deficit was the largest in any single month and greater than our Budget forecast for the full year.
This commentary compares the May 2020 Public sector financesrelease to monthly profiles consistent with the coronavirus reference scenario that we published on 14 April.