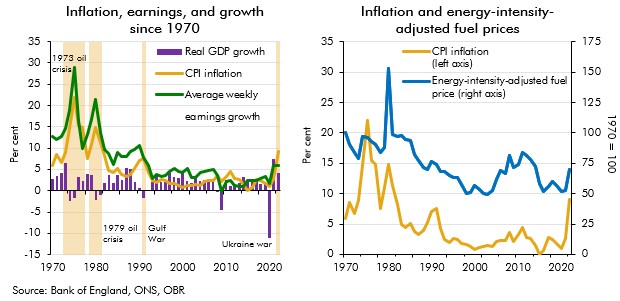
Chart A: Side-by-side charts: combination chart showing inflation, earnings and growth since 1970 and line chart showing inflation and energy-intensity-adjusted fuel prices

"It is the duty of the Office to examine and report on the sustainability of the public finances"