
In this box, we assessed how the OBR’s 2020 Covid scenarios compared with subsequent economic and fiscal outturns. While GDP broadly evolved within the range of the scenarios, inflation and nominal GDP were much higher than expected, reflecting supply disruptions and the 2022 energy price shock.
This box is based on ONS and OBR data from .
In the July 2020 Fiscal sustainability report (FSR), we presented three potential scenarios for the economy and the public finances over the medium term. These were the OBR’s first official projections to take full account of the emerging impact of the Covid pandemic. A ‘central’ scenario was presented alongside an ‘upside’ and a ‘downside’ scenario. This reflected the high uncertainty at that time around the length and severity of the pandemic and the impact it would have on the economy and public finances.a In this box, we build on the December 2021 Forecast evaluation report (FER), which assessed the short-term performance of these scenarios, and consider how they subsequently compared with outturn over the full five-year projection period. The scenarios were as follows:
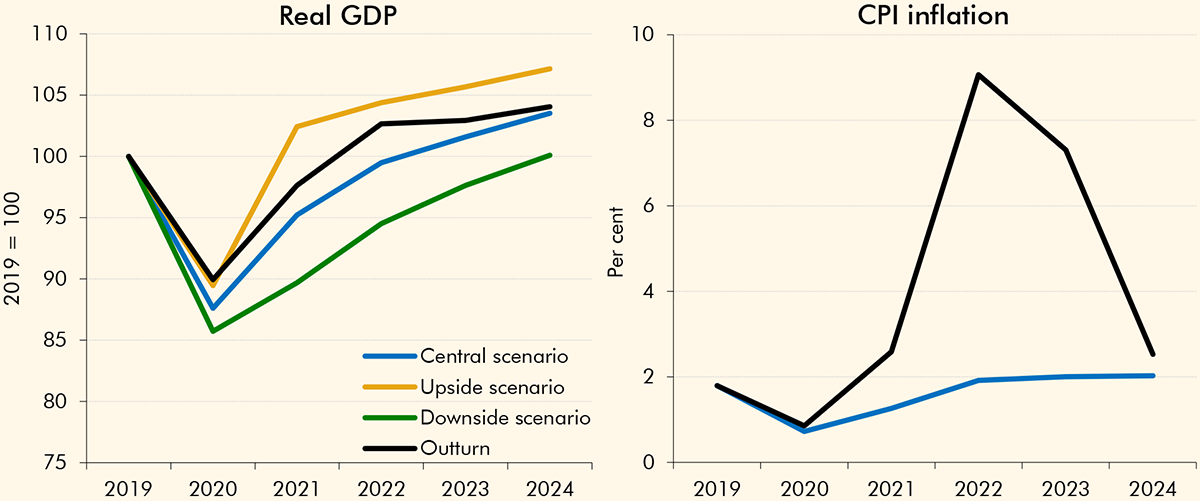
- The upside scenario assumed that activity would rebound relatively quickly from the pandemic, recovering its pre-virus peak by the first quarter of 2021, and there would be no enduring economic scarring.
- In the central scenario, output recovered more slowly, regaining its pre-virus peak by the end of 2022. Some medium-term economic scarring was assumed, with productivity hit by lower cumulative business investment and higher business failures, and with the equilibrium rate of unemployment remaining elevated.
- In the downside scenario, output recovered even more slowly, returning to its pre-virus peak only in the third quarter of 2024. This reflected a more significant hit to productivity and a higher medium-term unemployment rate as the economy was assumed to go through a period of significant restructuring.
Chart A shows the real GDP and inflation forecast under each scenario alongside the outturn over the relevant period. For real GDP, outturn was within the range assumed in these scenarios – broadly following a path between the central and upside scenario. This suggests the scarring assumption included in the central scenario may have been overly pessimistic. However, it is difficult to robustly assess this given the economy was hit by subsequent economic shocks and developments that were not foreseen at the time the scenarios were produced. For example, the impact of the pandemic on the labour market was seen at the time as a key area of potential scarring. Subsequent labour market developments present a mixed picture. While unemployment rose by less, and for a shorter period, than anticipated in the central scenario – likely partly due to subsequent extensions to the coronavirus job retention scheme and other labour market support measures – declines in labour market participation proved more persistent than expected. At the same time, subsequent population, and therefore labour supply, growth has been higher than expected mainly due to the unexpected spike in inward migration.
For inflation, which was assumed to follow the same path across all three scenarios, outturn was materially above expectations from 2021 onwards. At the time, we expected the pandemic to depress both demand and supply in the economy and therefore not lead to inflationary pressure. We assumed that inflation would be driven primarily by movements in energy prices – which initially fell sharply – rather than by domestic cost pressures. In practice, domestic demand recovered more quickly than expected after the initial impact of the pandemic, while uneven recoveries in supply across the globe, alongside a global shift of demand from services to goods due to the pandemic, created global supply bottlenecks. These factors pushed up inflation materially in 2021. Inflation then rose very sharply following the unforeseen 2022 energy price shock after Russia’s invasion of Ukraine. As a result, while by the end of the five-year period real GDP was broadly in line with our central scenario, nominal GDP was much higher than expected.
Chart A: Observed and forecast Real GDP growth and CPI growth
Source: ONS, OBR
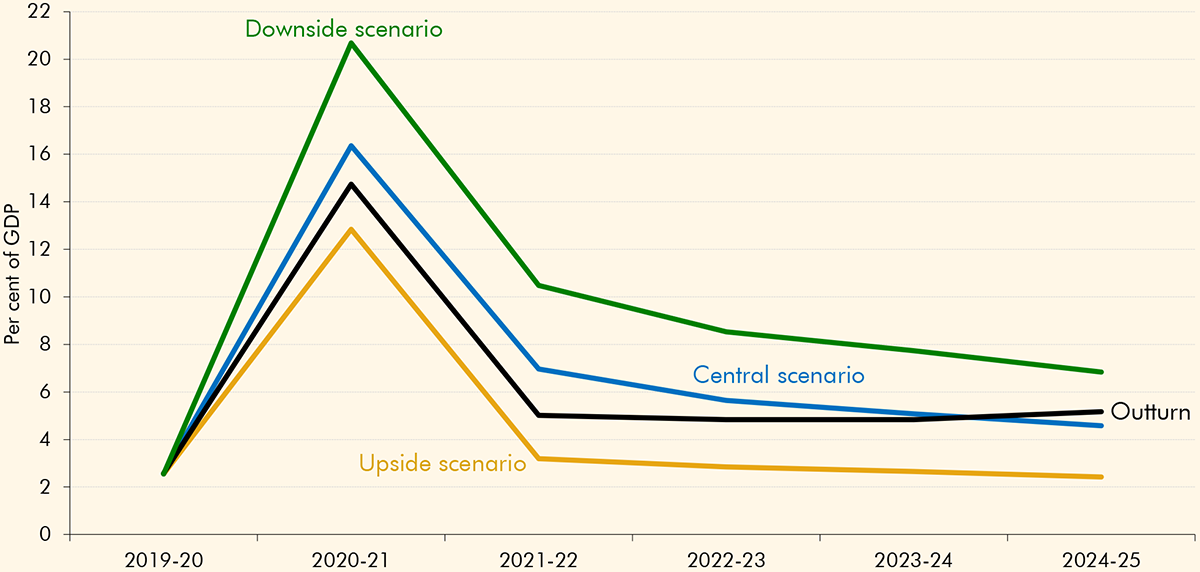
Chart B shows borrowing under each scenario, alongside the outturn over the five-year forecast period. The central scenario assumed a sharp rise in borrowing to 16.4 per cent of GDP in 2020-21 due to the impact of the pandemic, before falling sharply to 7.0 per cent of GDP in 2021-22 as the immediate impact of the pandemic was expected to recede. It was then projected to remain at around 5 per cent of GDP over the rest of the five-year period, which would have been still significantly above pre-pandemic levels.
Outturn borrowing in the short-termforecast years of 2020-21 and 2021-22 was between the upside and central scenario. The scenarios correctly anticipated the very sharp but largely temporary rise in borrowing, largely driven by the government support package, a rise in pandemic-related spending, and a fall in a broad range of receipts. This was particularly concentrated in personal taxes due to falling employment and earnings, and consumption taxes due to the various restrictions that limited consumer spending.
Over the medium term, outturn borrowing was broadly in line with the central scenario. However, this was driven by very large but mostly offsetting factors that were not anticipated at the time the scenarios were produced:
- It was expected that public spending would moderate after the pandemic and return broadly to pre-pandemic levels. In practice, higher-than-expected inflation from 2021 onwards, described above, pushed up spending compared to the scenarios in areas including debt interest and welfare. In addition, policy decisions were taken to raise departmental expenditure limits compared to previous plans, some of which reflected policy responses to the longer-term health impacts of the pandemic and to inflationary pressures. Overall, total spending was £216 billion higher than the central scenario in 2024-25.
- This was broadly offset in borrowing by receipts growing more strongly than anticipated. This was driven by the higher-than-expected nominal GDP growth, described above, combined with subsequent policy decisions to raise revenue – including the freezes to personal tax thresholds from April 2021. Overall, receipts were £180 billion higher than the central scenario. Around half was from higher income tax and National Insurance contributions boosted by higher-than-expected earnings and the impact of the threshold freezes.
Chart B: Outturn and July 2020 scenarios for public sector net borrowing
Source: ONS, OBR
Overall, these scenarios provided a reasonably accurate initial short-term assessment of the potential economic and fiscal impact of the pandemic. This shows the value of producing such scenarios even in times of very high uncertainty. We will continue to use scenarios in our EFOs to illustrate key risks to the central forecast, in line with recommendations from our 2025 external review.b The July 2020 scenarios did not anticipate the inflationary pressures that developed as the pandemic ended and could not have foreseen the subsequent 2022 energy price shock. The resulting much higher-than-expected inflation and nominal GDP growth led to both spending and receipts diverging significantly from the projections in the scenarios over the medium term. Understanding and evaluating the reasons for these divergences has been very important for learning lessons for future forecasts on the impact of inflation on the public finances, as is summarised in Chapter 4 of this report.
This box was originally published in Forecast evaluation report – June 2026