The independent Office for Budget Responsibility was established in 2010 to monitor the public sector’s finances. Twice a year – usually alongside each Budget and Spring or Autumn Statement – we produce detailed forecasts for the coming five years, assessing the likely impact of any policy decisions and expected developments in the economy. We then use these forecasts to assess the Government’s performance against the fiscal targets that it has set itself for the management of the public finances.
This guide provides a brief introduction to the UK public finances and to the terms used to describe them in the official statistics. In doing so we are looking at the finances of the public sector as a whole – which encompasses not just central government, but also the devolved administrations, local councils and public corporations.
The figures presented in this guide are taken from our March 2024 forecast, which covers the five fiscal years up to 2028-29. Each fiscal year runs from April to March.
A pdf version of this guide is also available to download here:
This guide provides a brief introduction to the UK public finances and to the terms used to describe them in the official statistics. We describe the main sources of government income and spending, and explain how these are used to calculate whether the government is running a surplus or a deficit. We also explain how government debt is defined and calculated.
Overview
 In each forecast we assess how the public finances are likely to evolve on the basis of existing Government tax and spending policies and our best guess at the likely evolution of the economy. In particular we try to estimate:
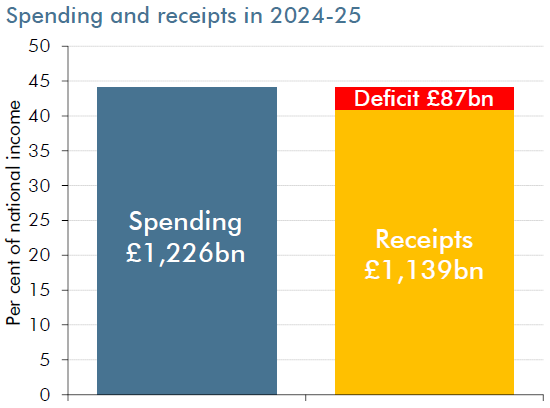
- how much money the public sector will raise from taxes and other sources of revenue. In 2024-25, we expect it to raise £1,139 billion, equivalent to around £39,000 per household or 40.9 per cent of national income.
- how much it will spend on things like public services, state pensions and debt interest. In 2024-25, we expect it to spend £1,226 billion, equivalent to around £42,000 per household or 44.0 per cent of national income.
- whether it will spend more or less than it raises – in other words whether it will run a budget deficit or surplus. In 2024-25, we expect a deficit of £87.2 billion. Because the growth in receipts outpaces that of spending, we expect the deficit to fall over the next five years to reach £39.4 billion.
- how much will be added to – or paid off – the national debt in each year. In 2024-25, we expect debt to be equivalent to 98.8 per cent of national income. It is equivalent to around £2.7 trillion or £96,000 per household. We expect the ratio of net debt to national income is at its peak in 2024-25 before falling gradually to reach 94.3 per cent in 2028-29. In cash terms we expect it to stand at £3.1 trillion by then. Taking out the effect of Bank of England (BoE) loans to banks and building societies, the debt ratio is expected to peak at 93.2 per cent in 2027-28 before falling slightly to stand at 92.9 per cent of national income in 2028-29.
Income
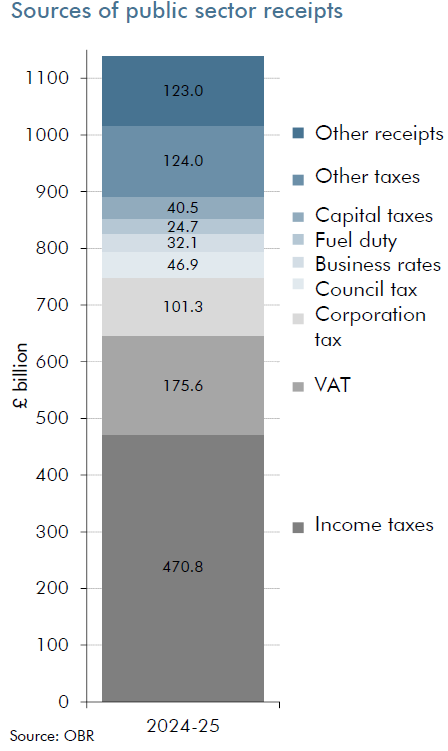 In 2023-24, we expect the public sector’s income to amount to £1,139.1 billion, equivalent to £39,000 per household or 40.9 per cent of national income. This income is called ‘public sector current receipts’ in the official statistics and comes from many sources.
Taxes are the most important at 89 per cent of the total in 2024-25. The taxes that bring in the most money are income tax and National Insurance contributions, which together are expected to raise around £470 billion. Value added tax (VAT) is the next most important, expected to raise £176 billion. Other big taxes include corporation tax, council tax, business rates, VAT refunds and fuel duty. No other tax is expected to raise more than £20 billion in that year.
The public sector also receives other revenues, including interest earned on its assets (such as foreign exchange reserves and student loans), while public corporations generate some income.
Over the next five years, we expect total receipts to rise by 16 per cent, faster than the growth in the cash size of the economy. We expect some taxes to rise more quickly than the growth of the economy as a whole, including income tax (driven by wages and salaries growing faster than frozen tax thresholds) and capital gains tax (driven by asset markets, like housing and the stock market). But some tax receipts are expected to fall, for example tobacco duty (because people are smoking less) and UK oil and gas receipts as energy prices and production decline.
Spending
 The public sector raises money in order to spend it, mostly on the day-to-day costs of providing public services, on capital investment and on cash transfer payments that support the incomes of various individuals and families.
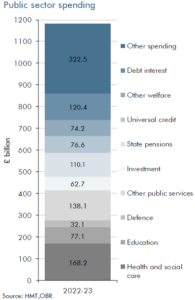
In 2024-25, we expect public spending to amount to £1,226 billion, which is equivalent to around £42,000 per household or 44.0 per cent of national income. This is called ‘total managed expenditure’ and covers many different types of spending.
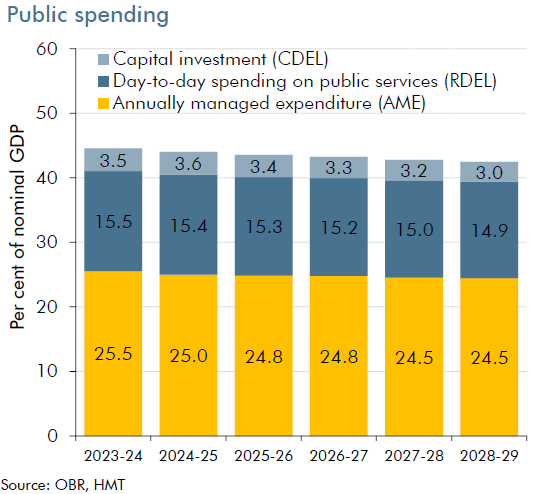
In 2024-25, we expect central government departments to spend £430.2 billion on the day-to-day (’current’) running costs of public services, grants and administration. This is 35 per cent of public spending. The biggest items are health (£179.6 billion), education (£84.9 billion) and defence (£32.8 billion). This spending is usually subject to multi-year limits set by the Treasury – known as ‘resource departmental expenditure limits’ or ‘RDEL’.
We also expect the public sector to spend £136.0 billion – 11 per cent of the total – on capital investment (such as roads and buildings) and on loans to businesses and individuals. Around 70 per cent of this will be spent by government departments, again usually subject to multi-year Treasury limits – ‘capital departmental expenditure limits’ or ‘CDEL’. Some of the remainder will be carried out by local authorities (mostly roads, schools and housing) and public corporations (like Transport for London), and 7 per cent of capital investment is on student loans.
The Government set out detailed department-by-department plans for RDEL and CDEL in its 2021 Spending Review. This set RDEL and CDEL plans for all departments for 2022-23 to 2024-25.
The biggest component of ‘annually managed expenditure’ or ‘AME’ is cash transfers through the welfare system, expected to cost £315.1 billion in 2024-25. 55 per cent of these are paid to pensioners, with state pensions the largest item at an expected £141.6 billion. Other big items include universal credit and the tax credits and benefits it is replacing (£92.0 billion) and disability benefits (£47.0 billion, around two-thirds paid to people of working age).
Net interest payments on the national debt are expected to cost £73.5 billion in 2024-25. This includes the interest government pays to private sector holders of the bonds it issues – known as ‘gilts’ – and also the interest paid by the Bank of England on the money created during the ‘quantitative easing’ of monetary policy since the late 2000s financial crisis and recession. Net debt interest (interest paid minus interest received) is expected to be 7.8 per cent of non-interest receipts in 2024-25 before falling slightly back to 7.1 per cent by 2028-29.
Over the next five years, we expect public spending to rise by 11 per cent in cash terms, 4 percentage points slower than the economy will as a result of temporary energy and cost-of-living support receding and reductions in departmental spending relative to the size of the economy.
Deficits and surpluses
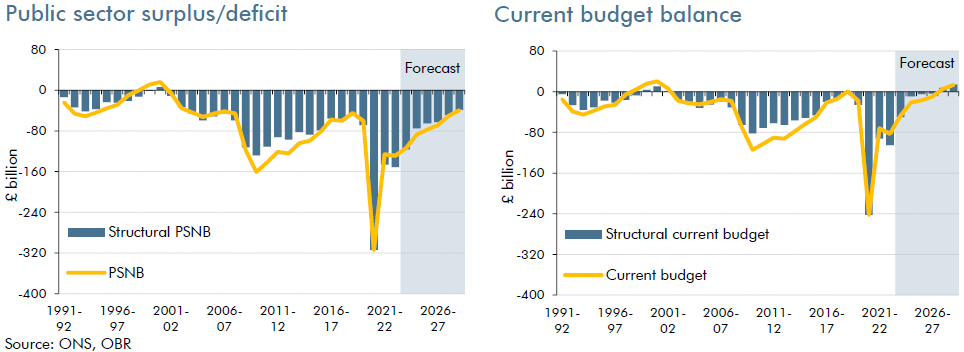
When total spending in a year is higher than total receipts, the Government needs to borrow to cover the difference. This gap is known as the budget deficit or ‘public sector net borrowing’. When receipts are higher than spending, the government runs a surplus. Deficits and surpluses are similar to losses or profits for a company.
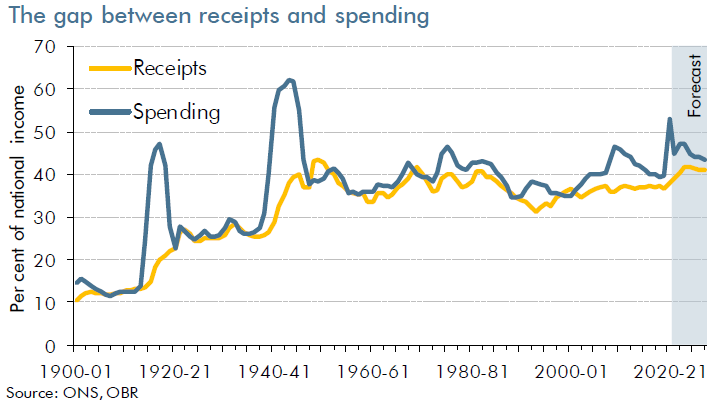
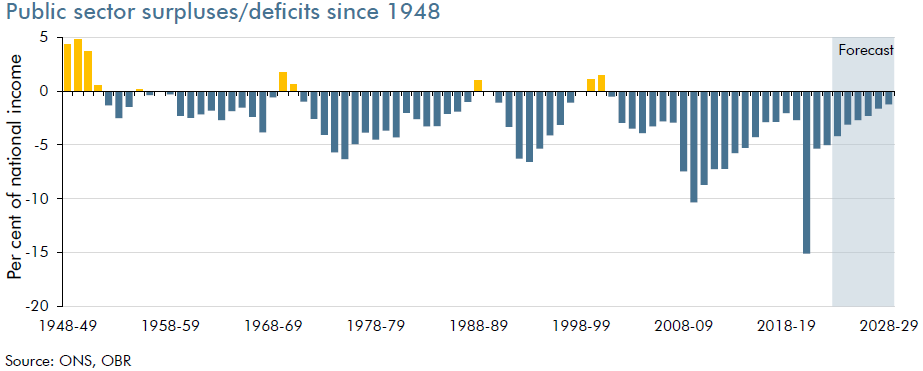
In 2024-25, we expect a deficit of £87.2 billion or 3.1 per cent of national income. This is a sharp fall from the 2020-21 peak of £314.7 billion, which was the highest since the second world war. Over the five-year forecast, we expect the growth in receipts to outpace that of spending and the deficit to fall. We expect the deficit to be £39.4 billion in 2028-29 when receipts are expected to be 41.2 per cent of national income and spending 42.5 per cent.
Swings into deficit have become steadily more pronounced over the post-war period. And budget surpluses have been achieved in only 10 years since 1948 and only three years since 1971-72.
Movements in the budget deficit are in part the result of the ups and downs of the economy. When the economy is strong, the deficit will be lower as taxes receipts increase and welfare spending costs are reduced. The opposite is true when the economy is weak.
The ‘structural’ budget deficit is an estimate of how large the deficit would be if the economy was operating at a normal, sustainable level of employment and activity. We never know precisely what this ‘normal’ level would be, so these estimates are always uncertain. Using our usual approach, we currently estimate that the economy is operating slightly below its sustainable level over the forecast period creating spare capacity before recovering by 2028-29. This is due to rises in interest rates in response to inflation continuing to feed through into the economy and slowing activity. This means that when there is spare capacity in the economy, the structural deficit is smaller than the overall deficit, with a ‘cyclical’ part of the deficit that would disappear automatically as the economy returns to a normal level of activity by the forecast horizon.
The headline deficit is the difference between total receipts and total spending, but people are also interested in the ‘current deficit’ (or surplus). This counts all receipts and all current spending, but excludes spending on net investment. As long as net investment is positive, the current deficit will be smaller than the overall deficit. We expect the current deficit to be £20.7 billion in 2024-25, and there to be a surplus of -£13.6 billion by 2028-29.
Debt
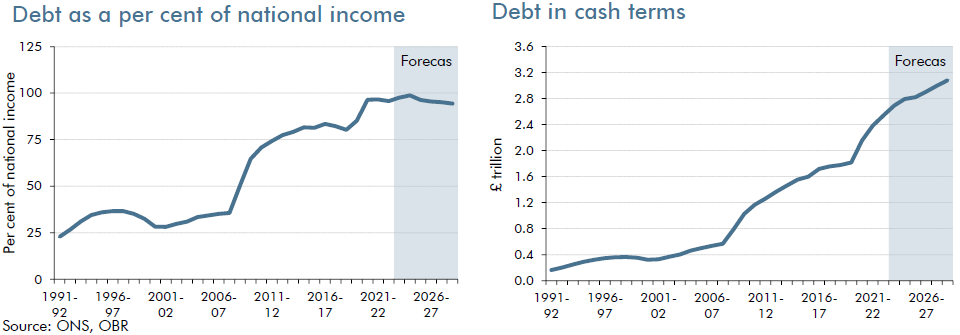
So far we have been looking at the flows of spending and receipts that take place each year and the deficits and surpluses they result in. But because governments run deficits much more often than they run surpluses, they have built up a significant stock of outstanding debt over time. Occasional crises, such as wars or pandemics, which increase expenditure or reduce receipts often add significantly to public debt.
Normally, if the public sector runs a deficit in a particular year, debt will rise in cash terms. But it can still fall as a share of national income if the cash size of the economy is growing sufficiently strongly. (That said, some government activity adds to its debt without adding to the deficit in any given year, most significantly providing loans to students and businesses where the loans are financial assets for the government, provided they are expected to be repaid in future.)
The most widely watched measure of debt in the UK is ‘public sector net debt’, which subtracts the relatively small amount of assets that the Government could readily turn into cash if required (for example, foreign exchange reserves) from the gross total. We expect public sector net debt to fall gradually from its peak of 98.8 per cent of national income in 2024-25 to 94.3 per cent of national income in 2028-29, which is equivalent to around £3.1 trillion or £104,000 per household.
One of the Government’s legislated fiscal targets is to make sure that debt (on a slightly different measure that removes the effect of BoE schemes, including loans to banks and building societies) is falling relative to national income in five years’ time, partly reversing the big increases associated with the financial crisis, pandemic and associated recessions and government responses. This target is only just met in our latest forecast.
International comparisons
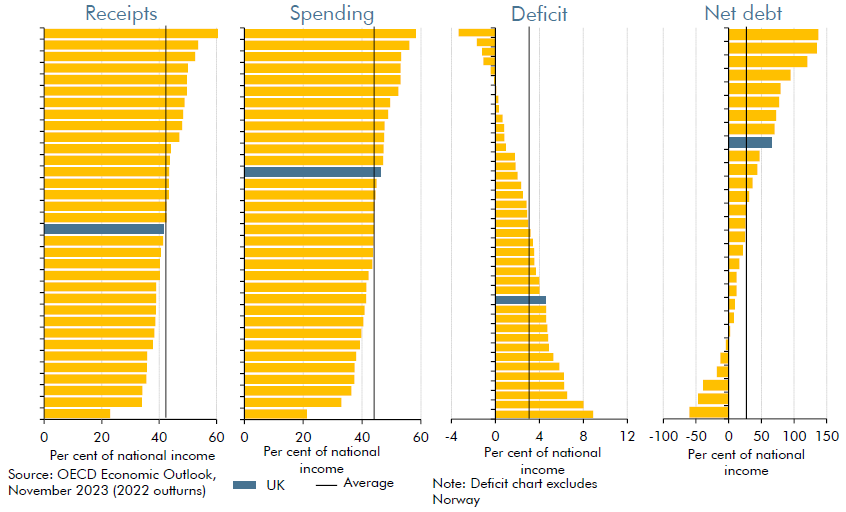
How do the public finances in the UK compare to those in other countries? To answer this question we can look at the data for 42 industrial countries produced by the Organisation for Economic Cooperation and Development (OECD). Unfortunately, the OECD data are not directly comparable with that we have presented so far: for example, the OECD does not cover public corporations, while it defines spending and revenue somewhat differently. The impact of the pandemic, war in Ukraine and subsequent energy price spikes has varied hugely between countries and has led to most countries shifting significantly from their usual fiscal position. The impact on the UK’s public finances in particular was comparatively large.
Those caveats aside, in 2022:
- The UK government raised slightly more revenue relative to national income than the US, Japan and Canada, but less than Germany and Scandinavian countries like Denmark and Norway.
- Public spending as a share of national income in the UK is slightly above the average of other industrial countries – the UK spends more than the US and Japan, but much less than Italy or France.
- Spending just above the international average, but raising less in revenue, leaves the UK running a budget deficit that’s above the industrial world average.
- Net debt in the UK is also higher than the average of other industrial countries.