
Box sets » GDP by expenditure » Net trade
Since the June 2016 EU referendum, our forecasts have incorporated a set of assumptions about the economic impact of Brexit on trade, productivity, investment, and migration. In this box, we assessed our current assumptions against the latest evidence.
There are signs that global economic integration has stalled in recent years on some measures and reversed on others. This box discussed the implications of integration for the economy and public finances.
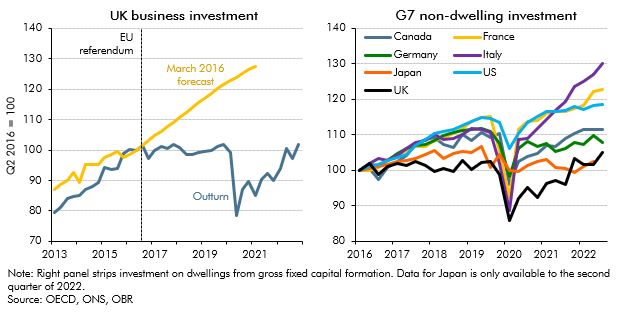
Our March 2022 EFO was published just over a year since the end of the transition period. In this box, we presented the latest evidence for the impact of Brexit on UK trade and considered the UK's recent trade performance relative to other advanced economies.
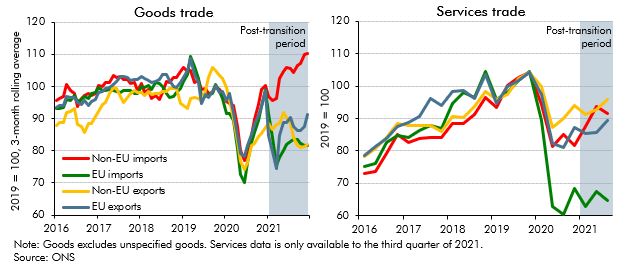
On 1 January 2021 some, but not all, of the provisions of the Trade and Cooperation Agreement came into effect following the UK's departure from the EU. In this box we looked at the initial impact of the new regime on UK trade patterns. We also considered whether the data was consistent with our assumption that Brexit will eventually reduce UK imports and exports by 15 per cent.
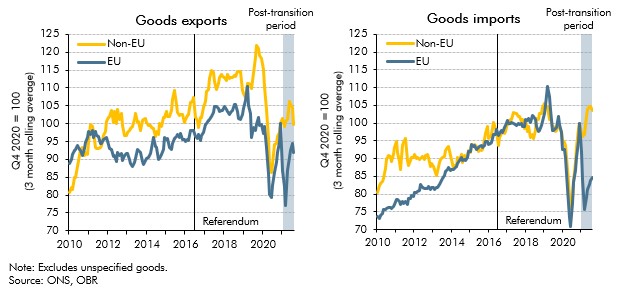
On 24 December, four and a half years after the EU referendum, the UK and the European Union concluded the Trade and Cooperation Agreement (TCA). This box compared the provisions of the TCA against our previous broad-brush assumption that UK-EU trade would take place under the terms of a ‘typical’ free-trade agreement. It also discusses the initial evidence regarding its short-term impact.
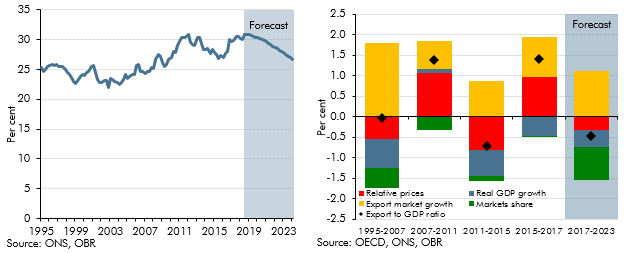
In August 2018 the Government announced an ambition to increase the UK's exports to 35 per cent of GDP. In this box we explored the drivers of previous changes in the exports-to-GDP ratio and how we expect it to change in our October 2018 forecast.
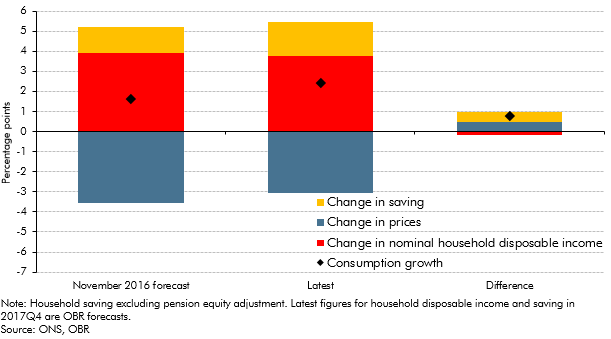
In the November 2016 EFO we made a number of judgements about how the vote to leave the EU would effect the economy in the near-term. This box from our March 2018 EFO compared these judgements against the outturn data that we had received since then, finding that most of these judgements were broadly on track.
Our first post-EU referendum forecast in November 2016 assumed that leaving the EU would result in a less open economy and lower productivity, but we did not incorporate an explicit link between the two over our medium-term forecast horizon. This box from our March 2018 EFO discusses why we did not include this link and what other forecasters have assumed.
In our November 2016 forecast, our first following the June 2016 referendum, we revised down our potential growth forecast, primarily reflecting the effect of weaker business investment on productivity growth. To give some context to our central forecast judgements, this box outlined a number of channels through which the decision to leave the EU could affect potential output and the uncertainty associated with estimating these effects.
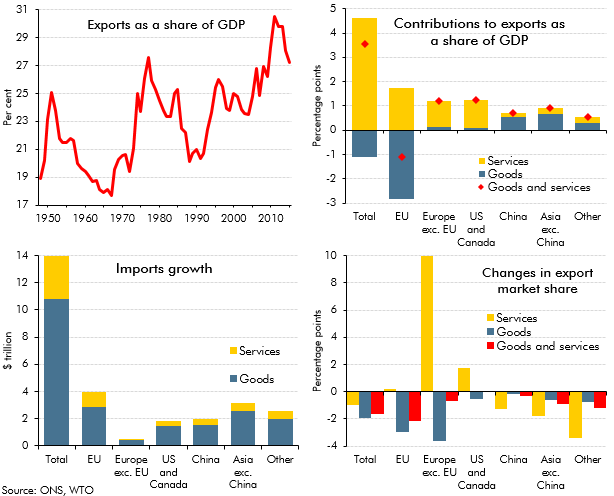
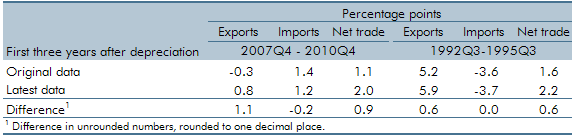
Following the June 2016 referendum result, we made a number of broad assumptions about the likely impact on trade, based on the average effects estimated in external studies. Given the importance of these assumptions, we looked at some past trends in this area, including the geographic composition and the relative importance of goods and services trade. We also set out some of the drivers of changes in exports as a share of GDP since 1999 and discussed the possible effects of trade on UK businesses and households.
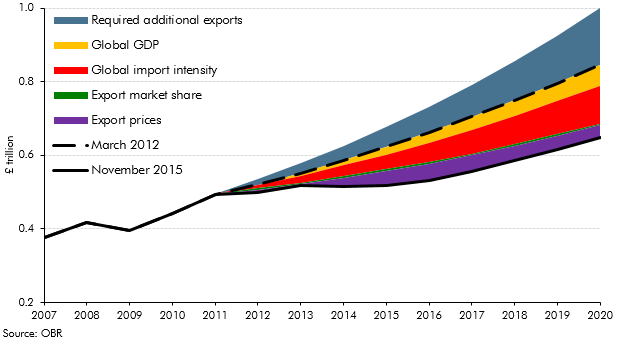
At Budget 2012, the Government stated its aspiration to increase the value of UK exports to £1 trillion by 2020. This box outlined the main drivers of export growth in our November 2015 Economic and fiscal outlook and the implications for our forecast relative to the Government's aspiration.
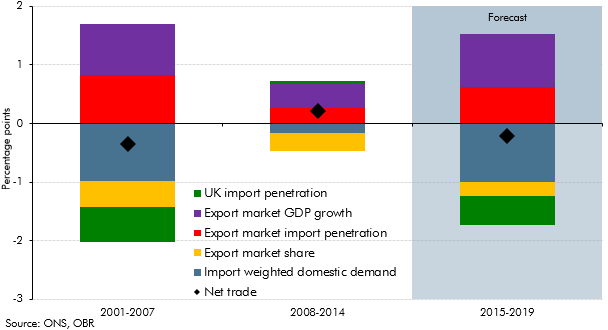
This box decomposed the net trade contribution to GDP growth into its various drivers, to illustrate the sources of the negative contribution in the seven years before the late-2000s recession, the positive contribution in the seven years after the recession and the negative contribution in the December 2014 forecast.
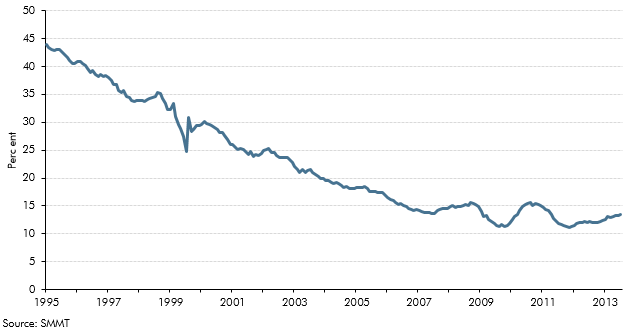
Spending on cars in the UK has grown strongly, accounting for nearly a third of household consumption growth since the third quarter of 2011. This growth was facilitated by car finance, which contributed to strong growth in unsecured credit. This box showed trends in domestic share of car production and contribution of domestic and imported cars to household consumption growth over time. Together, they showed that while domestic car consumption was a good indicator of consumer confidence, and car trade in isolation helped reduce the UK's trade deficit, the overall effect on the economy was less positive.
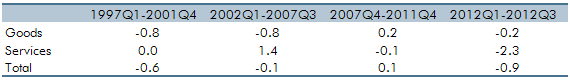
Exports fell during 2012, partly reflecting lower growth in UK export markets and a rise in sterling, although part of that fall was unexplained. This box looked at some past trends in the composition of exports to offer some explanation for that weakness, highlighting in particular the fall in financial services exports, and compared this against trends seen in the US.
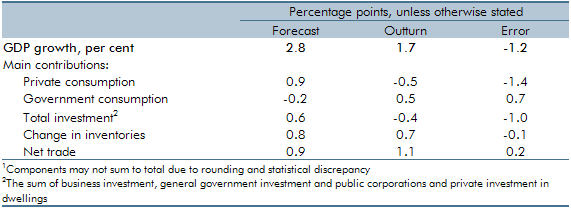
UK GDP had grown less quickly in 2010-11 than the OBR forecast in June 2010. This box decomposed the forecast error by expenditure component and discussed possible explanations, including the external inflation shock.
In the years following the financial crisis the euro area faced a sovereign debt crisis characterised by high government debt, poor confidence in sovereign solvency and rising risk premiums on government securities. This box considered the main channels through which an intensification of the crisis could affect the UK economy, including weaker trade, tighter credit conditions, higher domestic government borrowing costs and possible financial system impairment.
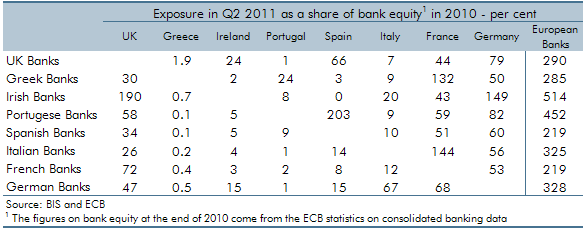
In 2010 Ireland’s sovereign debt markets had effectively closed and interest rates rose to record levels as it sought international financial assistance from the IMF and EU. This box considered the potential implications of this for our forecast, including reductions in trade, risks relating to the UK banking sector's exposure to Ireland, and higher UK interest rates resulting from widespread uncertainty in bond markets.