
Box sets » Demographics
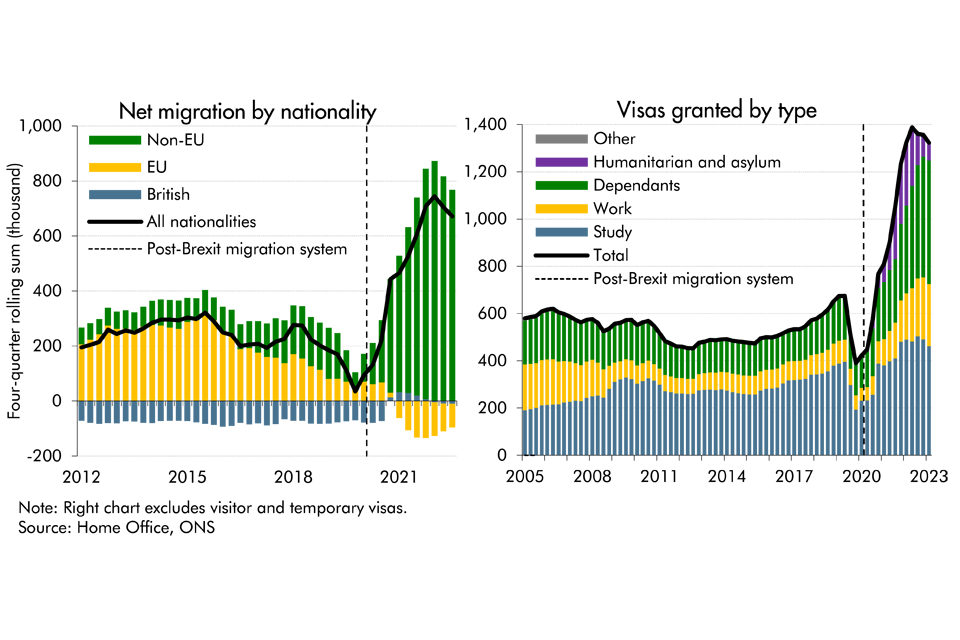
Latest data from the ONS suggest that net migration to the UK was higher than previously thought in recent years, while it's also projected to be higher than previously expected. In this box, we presented our migration forecast and its impact on labour supply. As there is considerable uncertainty around the outlook, we also considered alternative scenarios for net migration and its economic impact.

Following the upwards revision to our migration forecast, this box explored the implications of higher migration on our central forecasts for tax revenues, spending and borrowing. We also drew on alternative scenarios for migration to illustrate how uncertainty in the migration forecast translates into the fiscal forecast.
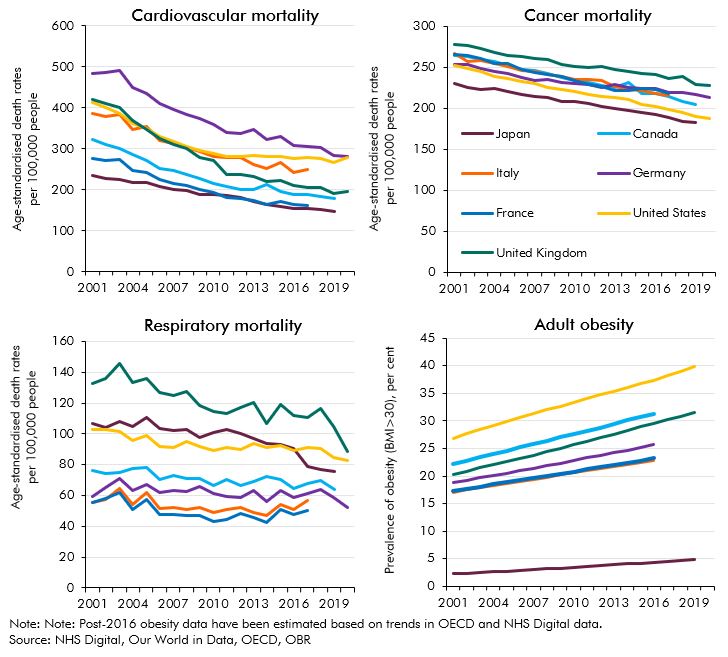
The improvements seen in life expectancy and a variety of other health indicators in the UK over a period of several decades have slowed down and - in some cases - partially reversed. This box detailed these changes and compares them to trends in other G7 countries.
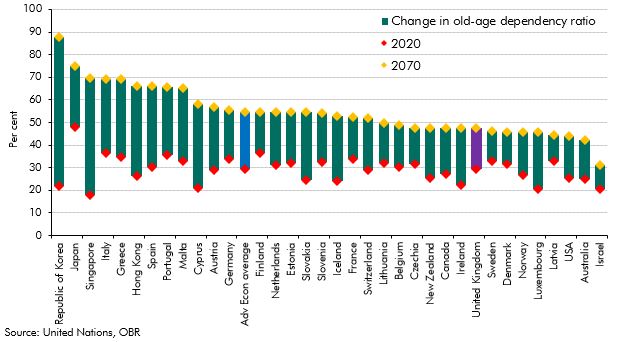
The populations of most advanced economies are ageing, placing new demands on these countries' public finances. This box explored why the UK population is forecast to age slower than most advanced economies over the next fifty years.
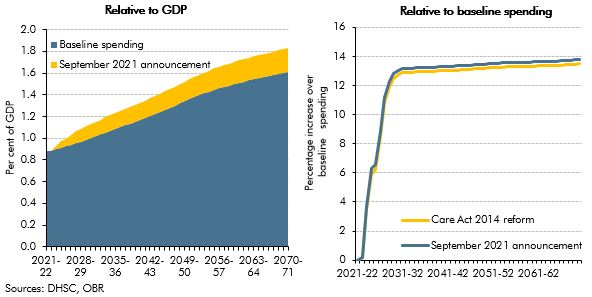
On 7 September 2021, the government announced a reform to the funding of adult social care in England. In this box, we described how this reform compares with the 2011 Dilnot Commission proposals and the reforms from the Care Act 2014 that were planned for April 2016 and then abandoned.
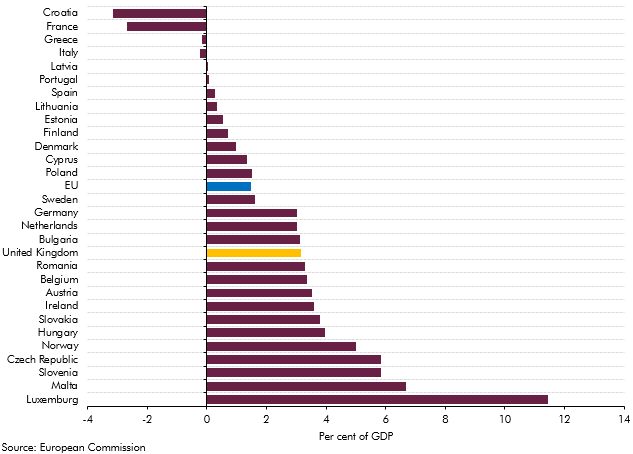
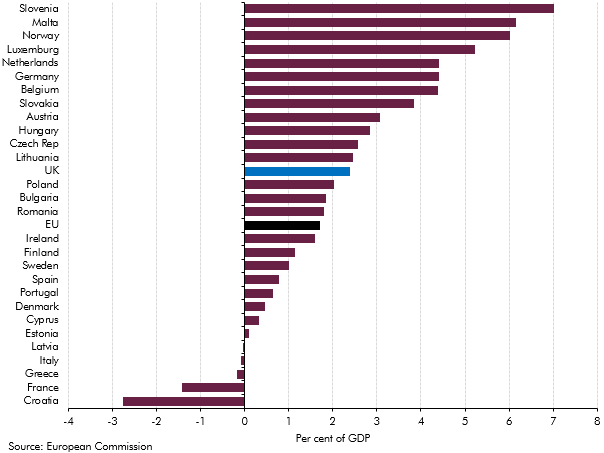
Our 2018 long-term fiscal projections suggested that, if left unaddressed, the public sector finances would come under increasing pressure over the next 50 years. This box compared our long-term age related spending projections over the period from 2025 to 2065 with those presented in the European Commission's 2018 Ageing Report.
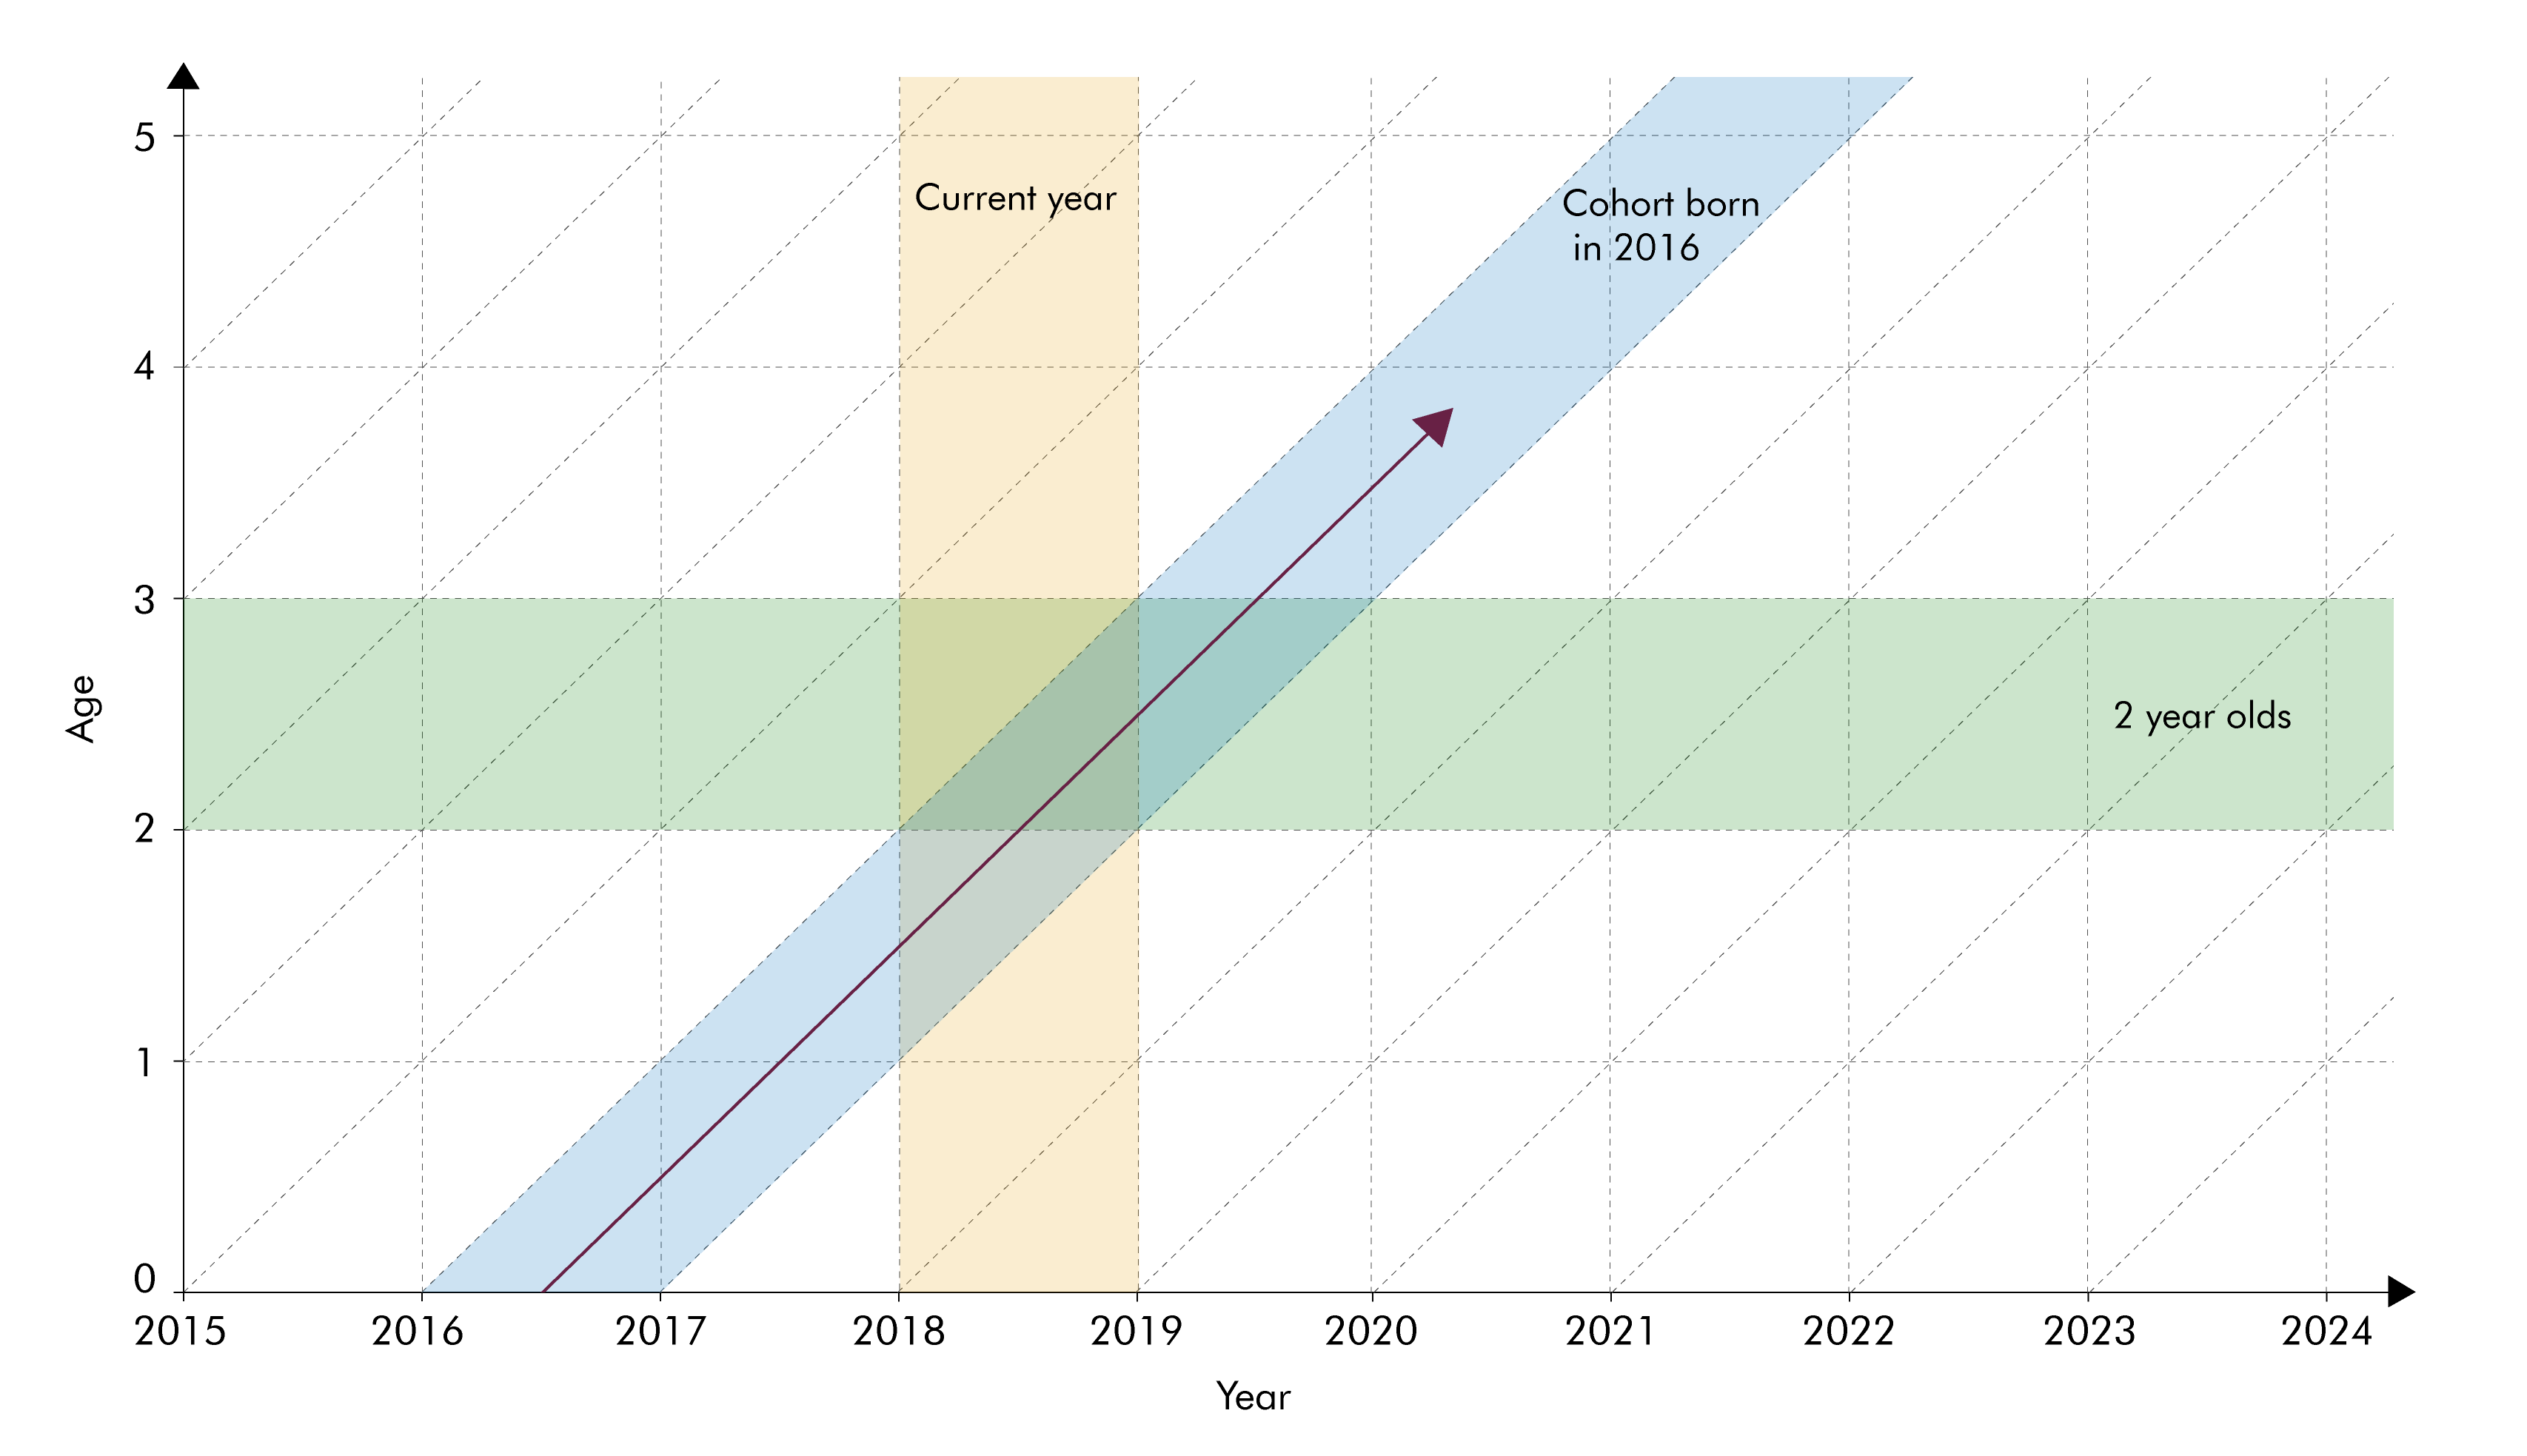
The population projections used to produce our long-term fiscal projections are underpinned by projections for age-specific fertility and mortality rates. In this box we considered two different ways of summarising trends in these rates - period and cohort metrics - and discussed their relative advantages.
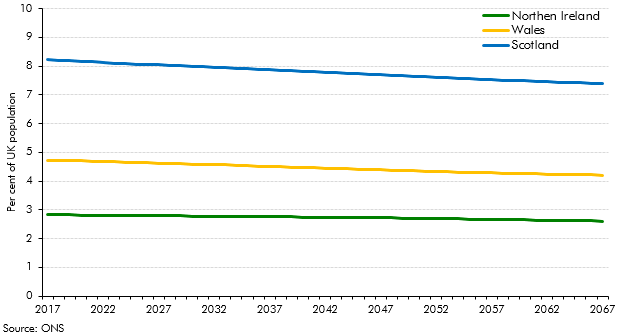
This box looked at differences in the Office for National Statistics’ population projections for the four constituent nations of the UK. It discussed the nations’ relative size and ageing, and possible implications for fiscal sustainability.
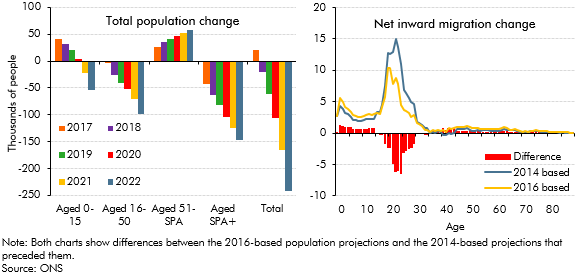
The Office for National Statistics (ONS) published new UK population projections in October 2017, based on 2016 population estimates and updated assumptions for fertility, mortality and net migration. This box compared the latest projections with the previous 2014-based principal projections that underpinned our March 2017 forecast and summarised their effects on our November 2017 fiscal forecast.
Our 2015 long-term fiscal projections suggested that, if left unaddressed, the public sector finances would have come under increasing pressure over the next 50 years due to rising age-related expenditure. This box compared our long-term age related spending projections with projections from the Ageing Working Group (2015) for the EU countries between 2020 and 2060.
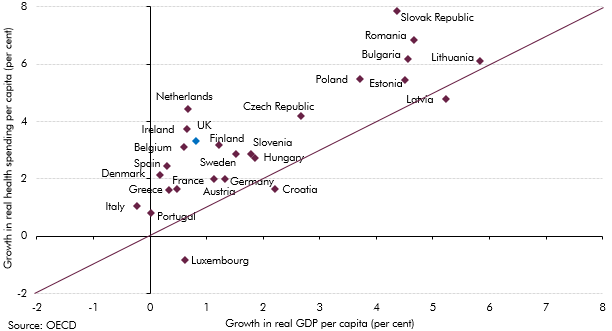
Health spending rose faster than GDP in almost all European countries over the past decade. This box investigated most notable long-term drivers of real spending on health care: demographic effects, income effects and other cost pressures.
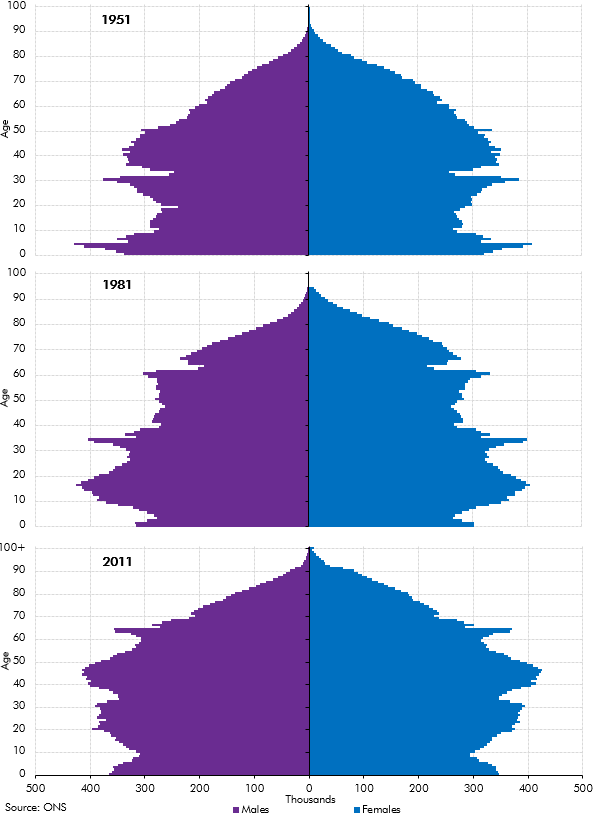
In our 2014 Welfare trends report, Chapter 3 reviewed the drivers of welfare spending. In this box we showed how the age structure of the population in England and Wales had evolved between the census years of 1951, 1981 and 2011. The post-war and 1960s baby-boom generations affect the dependency ratio in different ways over time, as these larger cohorts move from childhood to working adulthood and into retirement.
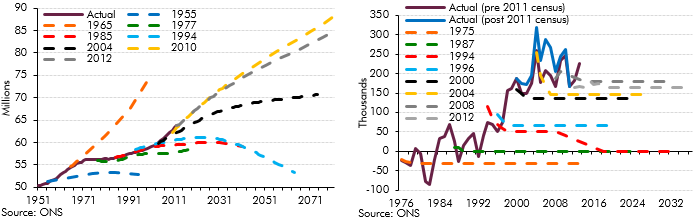
Population projections are subject to significant uncertainty, particularly over very long time horizons. This box outlined the error in successive population projections and the sources of error.
The ONS updates its population projections every two years based on mid‑year population estimates but every ten years it can draw on the latest census results. Census 2011 suggested that there were around half a million more people in the UK in 2011 than assumed in the population projections at the time, among other compositional changes. This box outlined some of the key findings from the census data and the impact this might have on our future projections.
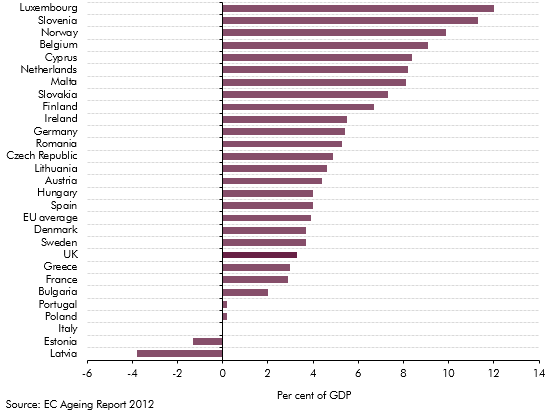
The European Commission (EC) produces its own analysis of ageing pressures for member states every three years. This box contrasted the forecast made by the EC and the OBR for UK age related spending such as pensions, health care and long-term care.
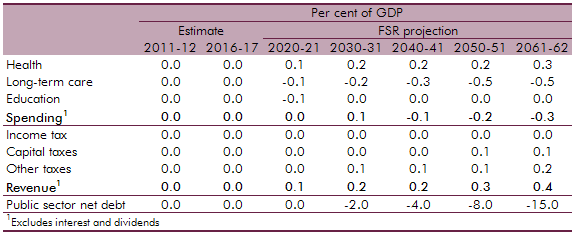
The National Institute of Economic and Social Research (NIESR) produce generational accounts estimates for the UK. The OBR produces its own long-term projections by using profiles that break down spending by year of age. This box compared the differences in public finance forecasts between the OBR and the NIESR with the latter implying a lower level of net debt by 2061‑62.
Some researchers argue that the fiscal position is unsustainable if future generations are left to make a larger net contribution to the government’s finances than today’s generation. Generational accounts such as those produced by the National Institute of Economic and Social Research (NIESR) consider intergenerational equity. This box analysed this as a measure of assessing fiscal sustainability.
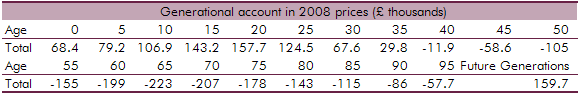
Solvency is not the only criterion that can be taken into account when assessing fiscal sustainability. This box outlined how generational accounts can be used to assess if future generations will be relatively worse off than current generations and the level of intergenerational fairness.