
Box sets » Data revisions
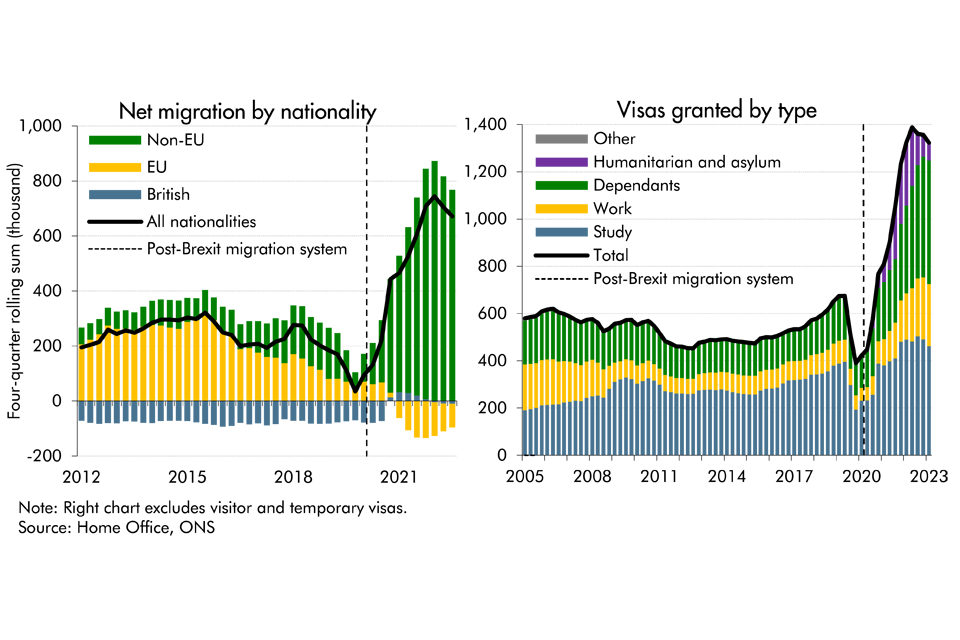
Latest data from the ONS suggest that net migration to the UK was higher than previously thought in recent years, while it's also projected to be higher than previously expected. In this box, we presented our migration forecast and its impact on labour supply. As there is considerable uncertainty around the outlook, we also considered alternative scenarios for net migration and its economic impact.
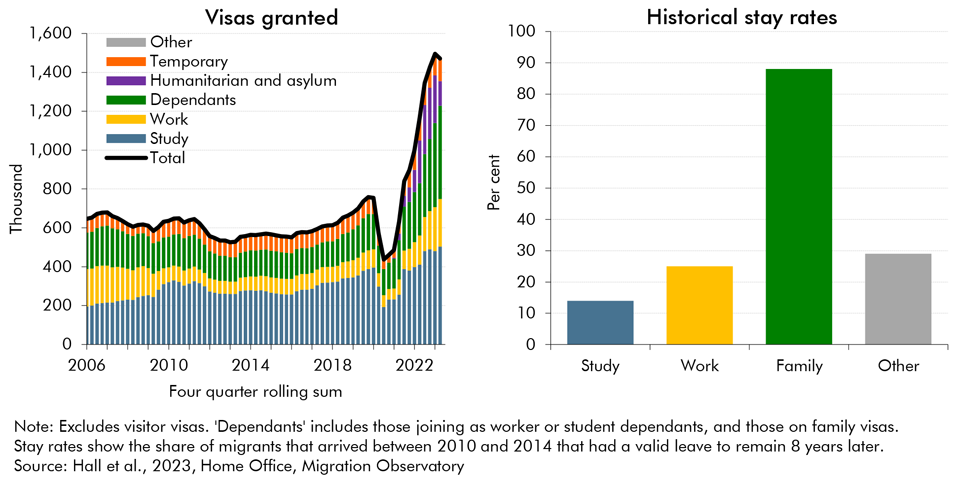
Net migration to the UK increased substantially in recent years but the ONS's population projections, that normally underpin our forecast, did not fully account for that rise at the time. In this box, we explored recent trends in migration and outlined our revised near-term migration forecast. We also examined how likely the migrants were to participate in the labour market.
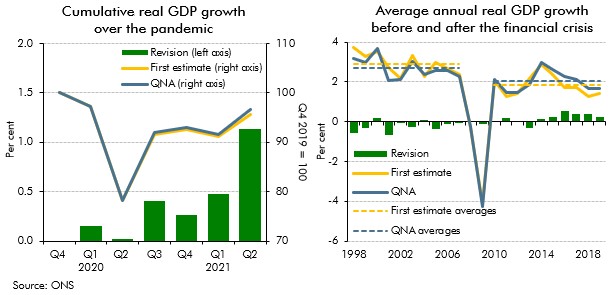
As we closed our pre-measures forecast earlier than usual at October Budget 2021, our forecast did not include the Quarterly National Accounts released on 30 September 2021, which contained Blue Book 2021 consistent revisions. This box examined the potential implications that including the latest data may have had on our forecast. We judged that the data revisions and other developments since we closed our forecast would have largely offset one another, leaving our economic forecast broadly unchanged.
Where the Government uses off-balance sheet financing to deliver public services this results in a 'fiscal illusion', where the recorded measures of debt and deficit do not reflect economic reality. In this box we looked at the case of housing associations (HAs). These came onto the balance sheet after the Government was given significant controls over them. The Government then legislated just enough to move HAs off-balance sheet. Neither movement made any fundamental change to fiscal sustainability.
The accounting treatment for student loans changed dramatically in 2019 adding more than £10 billion to the deficit. This box summarised the history of this change and a review into the design of post-18 education financing.
Our ability to forecast accurately is heavily dependent on the quality of the data we can use. In this box we explained how statistical and expenditure data could be distorted by problems in delivery of the benefit, and the difficulties this creates in identifying emerging trends in the data.
There are several possible approaches to forecasting benefit spending. In this box we outlined the key issues the modelling of disability benefits needed to address, the three approaches we used to forecast spending, and the strengths and limitations of each, concluding that a combination of approaches was better than reliance on any single one.
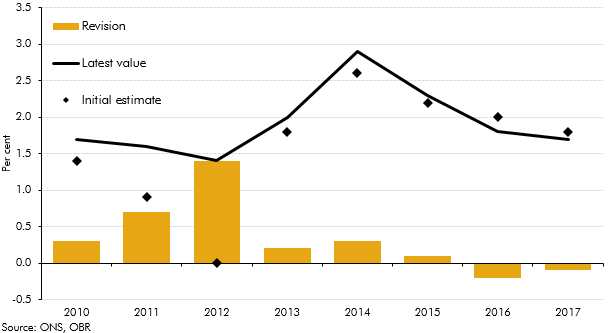
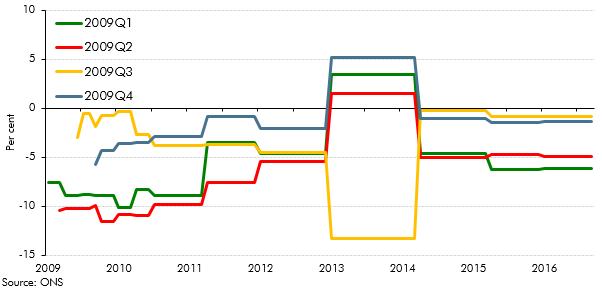
Revisions to National Accounts data are a normal part of the Blue Book process, which reconciles the different measures of GDP and incorporates information from annual data sources. This box explored how the estimated path of real GDP growth since 2010 has evolved over time, focusing in particular on revisions to GDP growth in 2012.
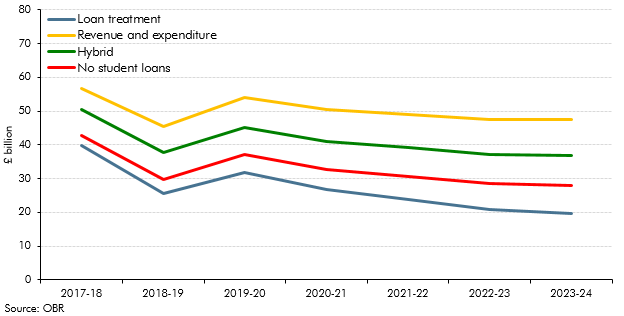
The accounting treatment applied to the burgeoning stock of student loans has been the subject of much interest over the past year, with reports from the House of Lords Economic Affairs Committee, the House of Commons Treasury Select Committee and the Office for National Statistics. In July, we published our own contribution in Working Paper No. 12: Student loans and fiscal illusions. In this box we analysed the possible impacts of different accounting treatments on our estimate of the deficit.
The Pension Protection Fund is a significant part of the public sector, but as of March 2018 it did not appear in either outturn public finances data or in our forecasts. This box from our March 2018 EFO explained why that was the case, and why recent announcements from the Office for National Statistics meant that it represented a significant classification risk to our forecast.
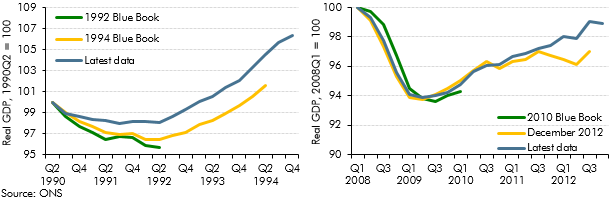
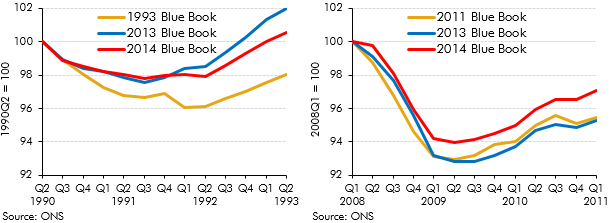
Revisions to National Accounts data are a normal part of the Blue Book process, which reconciles the different measures of GDP and incorporates information from annual data sources. This box explored how the estimated path of the 1990-92 and 2008-09 recessions and subsequent recoveries evolved over time, focusing in particular on revisions to GDP growth in 2011 and 2012.
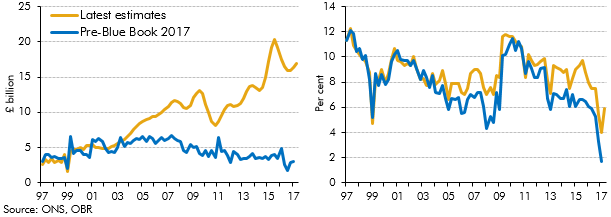
In recent years there has been a significant increase in the number of people setting themselves up as single-director companies (‘incorporations’), implying an increase in the share of household income received as dividends. ONS estimates of households dividend income were revised significantly as part of Blue Book 2017, and better capture this rise in incorporations. This box discussed the implications of these revisions, which implied a much higher level of household disposable income and household saving than previous estimates.
All elements of GDP data are subject to revision, which creates one source of uncertainty in our forecasts. Business investment data are particularly prone to revision. In this box from our March 2017 Economic and fiscal outlook we looked at past revisions in business investment data and compared the volatility and average revision of UK data with those produced by other countries.
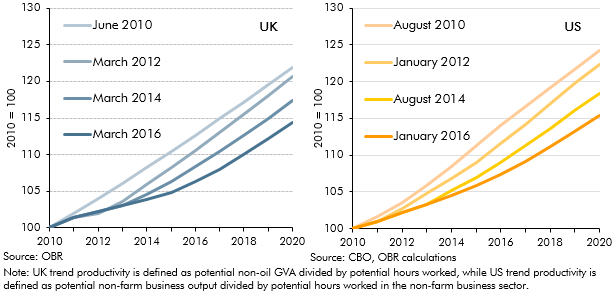
The path of productivity growth is a key driver of GDP growth in our forecast and is also one of the most uncertain judgements. In March 2016, given persistent weakness in outturn data, we revised down our forecast for productivity growth. But this issue was not specific to the UK, with productivity having disappointed in many other major advanced economies. This box compared different vintages of UK and US productivity and potential output forecasts since 2010 to illustrate this point.
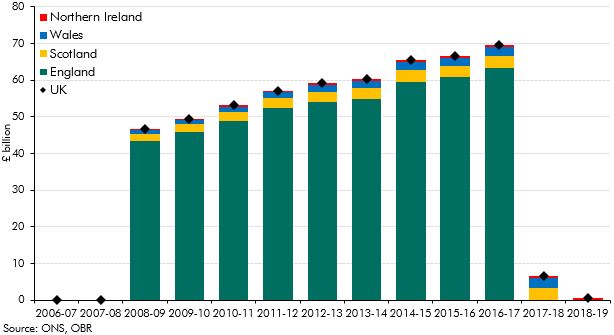
In our November 2015 forecast, we anticipated the effect on the public finances of the ONS decision to reclassify private registered providers of social housing in England. This box outlined the policy measures which affect our forecast, the effect on the public finances and changes in these forecasts since November.
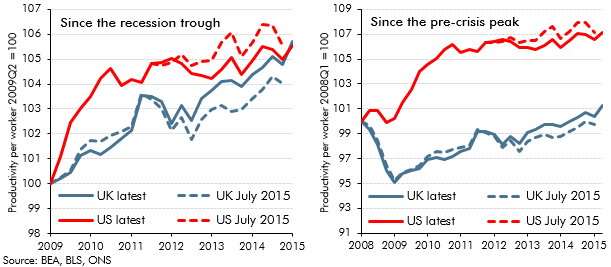
Recent estimates of UK GDP growth represent an early draft of economic history that will be revised, often substantially, over time. OECD found that initial estimates of UK GDP growth have tended to be revised up over time. This box also highlights revisions to estimates of US and UK productivity growth between July and November 2015, and the substantial productivity shortfall relative to the US and relative to the pre-crisis trend in the UK.
We always try to forecast the public finances consistent with how the ONS will measure them once it has implemented its classification decisions, so that our forecasts will be consistent with that eventual treatment. This box outlined the items included in our November 2015 forecast which the ONS had announced, but had yet to implement.
In recent years, historical path of business investment has been subject to significant revisions. This box discussed the revisions made to business investment estimates between 2007 and 2014. In Box 3.6 of our March 2014 Economic and fiscal outlook, we considered this issue from an international perspective.
Between 2012 and 2014, growth in the UK picked up, outpacing all other members of the G7. This box provided wider context for this strength in UK growth, comparing GDP, employment and productivity growth across G7 countries since 2008.
Public finances data are subject to regular classification and methodological changes. This box outlined the classification changes associated with the implementation of the new 2010 European System of Accounts (ESA10). Annex B of our March 2014 EFO explained these changes in more detail.
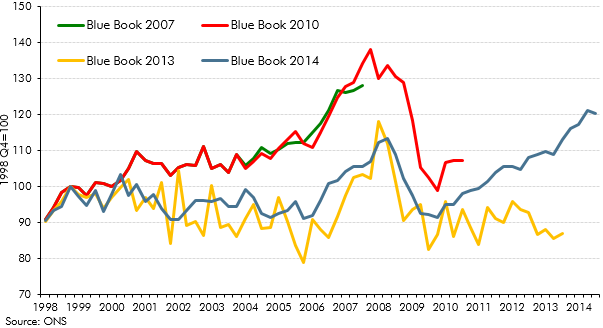
Revisions to National Accounts data are a normal part of the Blue Book process, which reconciles the different measures of GDP and incorporates information from annual data sources. The 2014 Blue Book contained particularly large changes because it was the first time that the National Accounts were published on an ESA10 accounting basis. This box set out some of the key changes in Blue Book 2014 and their impact on some of the key economy variables.
This box explored the implications of the new 2010 European System of Accounts (ESA10) on our public finances forecast, ahead of its incorporation in our December 2014 EFO. Annex B of our March 2014 EFO explained these changes in more detail.
The European System of National and Regional Accounts (ESA 10) changed the arrangements for funded defined benefit pension schemes. The new approach required that the net liabilities of these schemes for the future costs incurred from past activities were calculated using commercial accounting concepts. This box provided a summary of the effects that the new treatment would have, as well as its relevance to the Whole of Government Accounts (WGA).
Public finances data are subject to regular classification and methodological changes. This box outlined potential classification changes ahead of the PSF review. Annex B of our March 2014 EFO explained these changes in more detail.
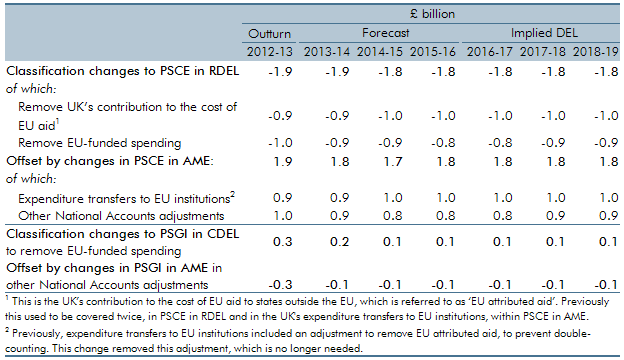
In this forecast, we switched to using spending data from a new source, which was the Treasury’s new public spending database known as OSCAR (short for their ‘Online System for Central Accounting and Reporting’). This led to some switches between DEL and AME, which we treated as classification changes, because they affected our presentation of DEL and AME for all years, including outturn and forecasts. This box explained those changes.
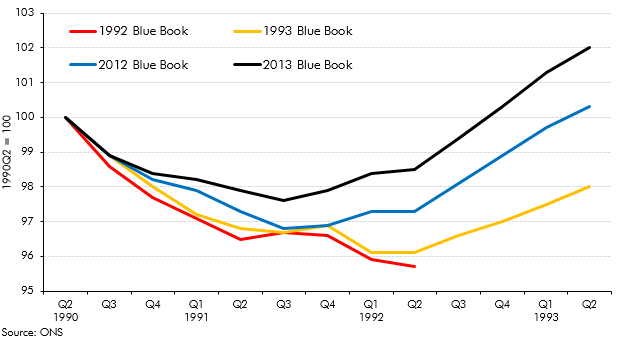
Revisions to National Accounts data are a normal part of the Blue Book process, which reconciles the different measures of GDP and incorporates information from annual data sources. This box explored how the estimated path of the 1990s recession and recovery evolved from estimates made in the 1992 Blue Book to estimates made in the 2013 Blue Book.
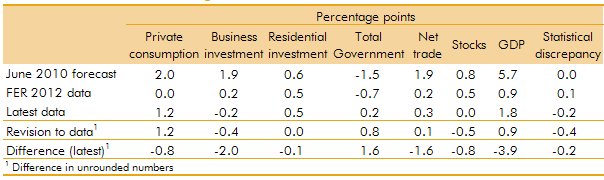
In our 2012 Forecast Evaluation Report, we noted that nominal GDP had held up closer to our June 2010 forecast than real GDP, helping to explain why our fiscal forecasts out to 2011-12 had remained broadly on track. This box in our 2013 Forecast Evaluation Report discussed how this assessment changed in light of revisions to GDP data. While nominal GDP now appeared to be weaker than forecast, the relatively tax-rich components - such as nominal consumption and wages and salaries - held up relatively well.
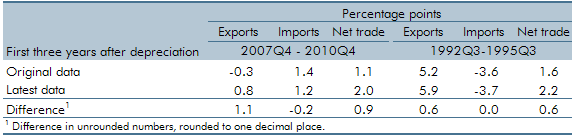
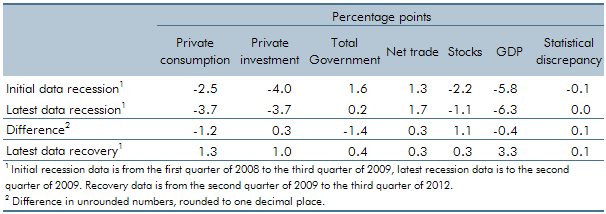
Revisions to National Accounts data are a normal part of the Blue Book process, which reconciles the different measures of GDP and incorporates information from annual data sources. This box explored the different picture of the late 2000s recession and recovery in light of the 2012 Blue Book.
In 2012 the ONS carried out a range of methodological development work relating to consumer prices indices. This box summarised some of the key elements, including work addressing the 'formula effect' which had made an increasing contribution to the CPI-RPI 'wedge' in 2010 and 2011. This box also discussed ONS analysis and recommendations from Consumer Prices Advisory Committee on the appropriate measurement of owner occupiers’ housing (OOH) costs and their inclusion in a new index of consumer prices.
During the financial crisis, both Bradford & Bingley (B&B) and Northern Rock (Asset Management) (NRAM) were transferred to public ownership. The ONS has announced that it will reclassify both bodies into the central government sector. This box outlined the impact of the reclassification on our fiscal forecast.
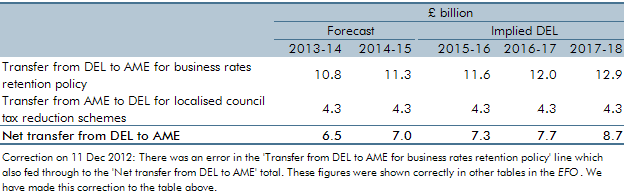
In this forecast there were two policy switches that shifted spending between RDEL and AME, which applied from 2013-14 onwards. These policies were for the 50 per cent retention of business rates for local authorities in England, and for localised council tax reduction schemes. This box outlined these changes and examined the subsequent impact these would have on our forecasts.
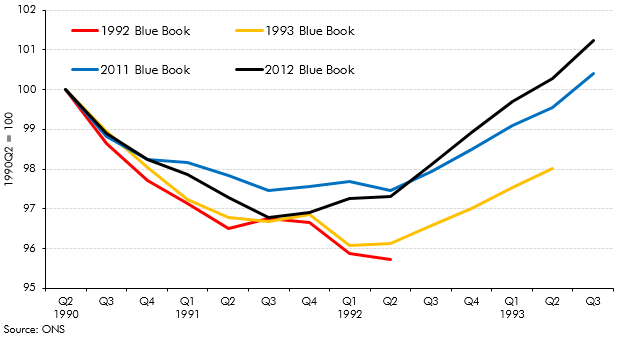
Each year, the ONS publishes the National Accounts ‘Blue Book’. The revisions it contains are often a source of revisions to our subsequent forecasts. In this box, we illustrated the scope for history to be rewritten by exploring how the reported pattern of the recession and recovery of the early 1990s had evolved between the Blue Books published shortly after the recession and the most recent Blue Books available at the time.
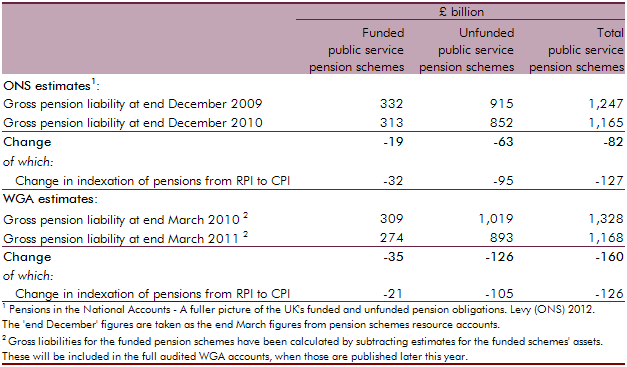
In April 2012, the Office for National Statistics (ONS) published the first set of new statistics on the total gross liabilities of UK pension providers, including the UK government. This box explored how the ONS’ pension liability estimates were calculated for public service pensions and state pensions, and compared the public service estimate to the Whole of Government Accounts (WGA) methodology.
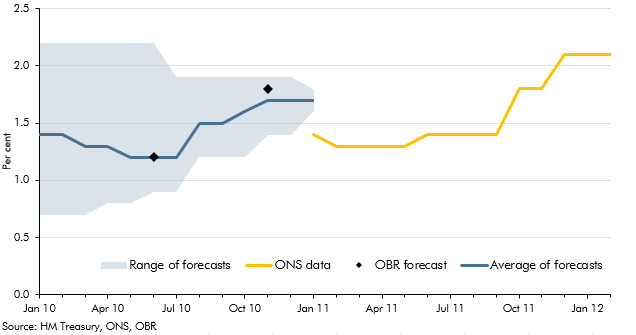
Both forecasts and National Accounts data are subject to revision. This box discussed how outside forecasts for growth in 2010 evolved through that year and compared these forecasts with ONS outturns, from the ONS' first estimate made in January 2011 through to their latest available estimate in February 2012.
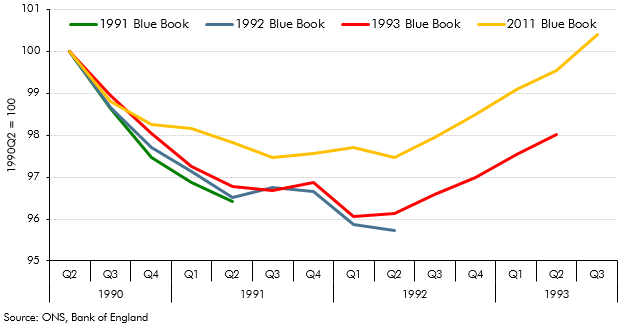
Revisions to National Accounts data are a normal part of the Blue Book process, which reconciles the different measures of GDP and incorporates information from annual data sources. This box explored how the estimated path of the 1990s recession and recovery evolved from estimates made in the 1992 Blue Book to estimates made in the 2011 Blue Book.
Our November 2011 forecast implied that households would take on around £480 billion of additional debt over the forecast period. This box discussed the implications of this for the household balance sheet, noting that a large part of the increase in household debt reflects borrowing for the purchase of assets. The box also discussed the downward revision in our household debt forecast since our previous EFO, which was largely accounted for by a combination of higher saving and a weaker housing market outlook.
Revisions to National Accounts data are a normal part of the Blue Book process, which reconciles the different measures of GDP and incorporates information from annual data sources. This box set out the key differences between the vintage of data used for the purposes of the October 2011 Forecast Evaluation Report and the data consistent with the 2011 Blue Book.
The majority of Private Finance Initiative (PFI) assets are held off the public sector balance sheet in the National Accounts. The running costs relating to existing PFI contracts are included within agreed departmental spending envelopes. This box explored the impact on our net debt projections if all capital liabilities relating to PFI contracts were included.
Data available at the time of our November 2010 Economic and fiscal outlook suggested that general government employment fell by 550,000 between 1992 and 1998. But some of this fall reflected the reclassification of further education colleges and sixth-form school employees from the public to the private sector in 1993. This box outlined a simple methodology which suggested that general government employment would have fallen by just over 400,000 over that period in the absence of this reclassification.