The majority of Private Finance Initiative (PFI) assets are held off the public sector balance sheet in the National Accounts. The running costs relating to existing PFI contracts are included within agreed departmental spending envelopes. This box explored the impact on our net debt projections if all capital liabilities relating to PFI contracts were included.
The running costs relating to existing PFI contracts are included within agreed departmental spending envelopes. As relatively fixed long-term obligations, these have the potential to reduce the flexibility for other spending in the future. If no further deals were signed, annual payments would peak over the current Spending Review period, and then remain at broadly similar levels over the following 10 years, before gradually tailing off. These payments constitute less than 3 per cent of resource DEL over the Spending Review period. Our central long term projections assume that these expenditures will remain constant as a share of GDP from 2015-16, and that they will continue to be met within spending envelopes. This assumption is consistent with a policy of continuing to sign PFI contracts where they represent value for money.
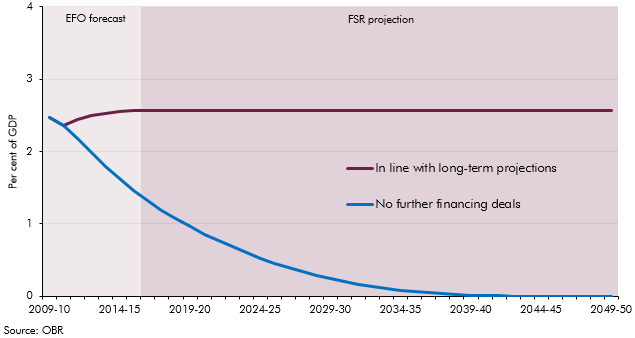
As discussed in Box 2.2, the net present value of existing capital liabilities for on-balance sheet PFI contracts is added to net debt. But the majority of PFI assets are currently held off the public sector balance sheet in the National Accounts. Chart B illustrates the impact on our net debt projections if all capital liabilities relating to PFI contracts were included. At March 2010, these additional elements totalled a little under £35bn, or around 2.5 per cent of GDP.
The first profile is consistent with the assumption in our projections that PFI expenditures are constant as a share of GDP. In this case, the impact is constant over the projection period – and would increase net debt in our central and variant projections by around 2.5 per cent of GDP in each year. The second assumes no further lease contracts are signed so the direct impact on net debt trends towards zero over time as the liability is paid off.
Chart B: PFI payments in future under different scenarios