In assessing indicators of sustainability we examined the role of the gap between the real interest rate on government debt and the long-run growth rate of the economy. This box outlined the reasons behind Post-World War II debt reduction.
This box is based on IMF national debt and ONS government debt data from June 2013 and June 2013 respectively.
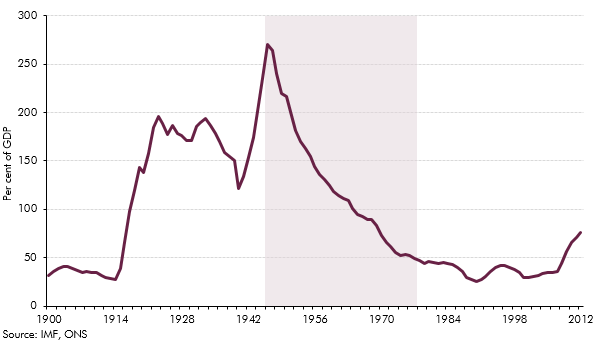
Shortly after the end of the Second World War, UK government debt peaked at around 270 per cent of GDP. Over the subsequent three decades, the debt ratio fell steadily to around 50 per cent of GDP (Chart A). Given the current high ratio of public debt to GDP in the UK and any advanced economies, it is interesting to note the factors that accounted for the reduction in the public debt burden over this period.
Chart A: UK national debt 1900-2012
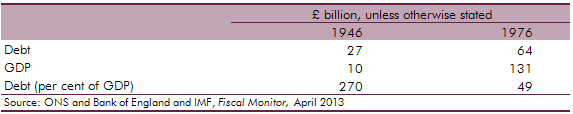
Over the 30 years from 1946, national debt increased from £27 billion to £64 billion in nominal terms. That £37 billion increase was almost entirely due to the issuance of fresh debt to cover interest payments over the period, as successive governments ran a cumulative primary (i.e. non-interest) surplus of £7.6 billion over this period, averaging 1.6 per cent of GDP a year. Both non-interest spending and receipts were broadly flat as a share of GDP over most of the 30 years.
In nominal terms, GDP grew by 8.8 per cent a year on average over this period, comprising 2.3 per cent average annual real GDP growth and a 6.5 per cent average annual rate of whole economy inflation. The growth rate of nominal GDP was higher than the 3.6 per cent average effective interest rate paid by the government on public debt. This large average difference meant that the debt ratio would have fallen as long as the primary balance was in deficit by no more than 6.4 per cent of GDP on average, though that average disguises a very wide range from year to year.
The interest rate on government debt was also lower than the inflation rate in 24 of the 30 years, notably when inflation was particularly high. The persistence of these negative real interest rates in part reflected ‘financial repression’ – in other words, that the interest rates at which the government could borrow were held below inflation by a number of institutional and policy factors.a Among them was the Bretton Woods system, which featured restrictive exchange rate controls and a fixed exchange rate. Quantity and price controls on domestic bank lending also encouraged domestic financial institutions to invest in government debt.
When the percentage increase in nominal debt caused by interest payments is lower than the percentage increase in nominal GDP from economic growth, the ‘snowball’ effect on the public debt to GDP ratio is to reduce that ratio. In nominal terms, debt increased by 137 per cent over the 30 years, but nominal GDP increased by more than 1,200 per cent in the same period. This reduced the debt ratio by four-fifths of its original level to less than 50 per cent of GDP (Table A).
Table A: The UK debt and GDP profile in 1946 and 1976