In April 2012, the Office for National Statistics (ONS) published the first set of new statistics on the total gross liabilities of UK pension providers, including the UK government. This box explored how the ONS’ pension liability estimates were calculated for public service pensions and state pensions, and compared the public service estimate to the Whole of Government Accounts (WGA) methodology.
This box is based on Pensions in the National Accounts, ONS and Whole of Government Accounts, HMT data from April 2012 and October 2012 respectively.
In April 2012, the ONS published the first set of their new statistics on the total gross liabilities of UK pension providers, including the UK government. These cover pensions provided by private sector workplace schemes, public service pensions, and state pensions. The statistics show the pension liabilities at the start and end of 2010. Because these new ONS statistics are still being developed, they are currently described as ‘experimental’ statistics, rather than National Statistics.
Like WGA, these ONS pension liability statistics only cover future pension liabilities that have accrued from past employment. They also assume that future pension payments are based on existing pension policies. The ONS have developed these new statistics as part of the requirements of the new European System of Accounts (ESA2010). All EU member states will be required to produce this new information, probably from 2014 onwards, as supplementary information alongside the main National Accounts.
These liability statistics are calculated using a standard set of assumptions, designed to make the statistics comparable across EU countries, including that the discount rate for public service pensions should be 3 per cent real, or 5 per cent nominal. The discount rate will remain fixed, which means that, in due course, these statistics can be compared across a longer time series: the liabilities will increase by the additional liabilities accrued from the current year’s employment, and will reduce by pensions paid – and these changes will be comparable from year to year.
Table A compares the ONS and WGA estimates of public service pension liabilities. Both estimates are derived from the same information source – the resource accounts for the pension schemes. However the ONS adjust the accounts data for the different discount rate required under ESA2010, using a methodology provided by GAD. Table A shows that, at the end of 2010, the ONS estimated the gross liability for public service pension liabilities to be £1,165 billion, which is very close to the WGA estimate of £1,168 billion at 31 March 2011. The ONS real discount rate (3 per cent) is close to the real rate applied in the WGA at the end of 2010-11 (2.9 per cent). The ONS estimate for the change in the liability due to the change in indexation from RPI to CPI is also very close to the WGA estimate. The estimates of the liabilities at end 2009 (or 31 March 2010) differ because the WGA liability at that time was based on a real discount rate of 1.8 per cent.
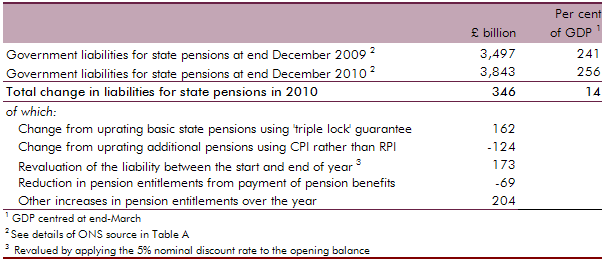
The ONS estimates for the government’s liabilities for state pensions are shown in Table B. These are based on long-term projections provided by DWP and are produced on a similar basis to those which DWP provide for the analysis in Chapter 3 of this report. However, for ONS purposes DWP base the projections on the specific assumptions required under ESA2010 and only include payments that have accrued from past activities. In Chart 3.6 in Chapter 3, we show how the latest DWP long-term projections for pensions are divided between these payments for past accruals and the payments that are projected to accrue from future activities.
Table A: ONS and WGA estimates of public service pension liabilities
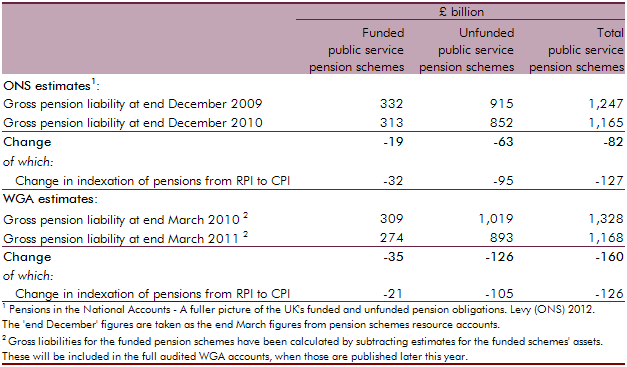
Table B: ONS estimates of government liabilities for state pensions