
Local authorities’ net use of reserves (the amount they add to or drawdown from their stock) is a key judgement in our local authority current spending forecasts as it directly affects borrowing. This box outlined recent trends in use of current reserves, split by English authorities with and without upper-tier responsibilities (such as education and social care), which underpinned our November 2017 forecast judgements.
In 2015-16 and 2016-17, English local authorities drew down from their stock of reserves by £0.4 and £1.5 billion respectively. This reversed the post-crisis build-up of reserves, which saw them rise by an average of just under £2 billion a year between 2010-11 and 2014-15.
We had expected the squeeze on local authority finances to prompt reserves drawdowns much earlier than has been the case, but the corner does now seem to have been turned. This may reflect budget pressures finally reaching the point at which authorities use reserves to maintain current levels of spending, although it is also possible that the reserves had been earmarked for use on specific projects that have now commenced. Prior to 2015-16, English local authorities last drew down from their reserves in 2009-10 (by £0.3 billion).
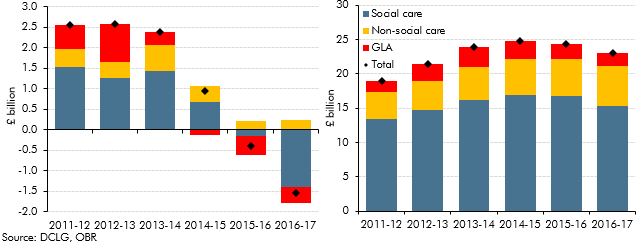
One striking feature of the net reserves drawdown last year was the difference in behaviour between local authorities with and without social care responsibilities. While the behaviour of individual authorities differed across years, Charts E and F show that within broad categories:
- The stock of reserves increased between 2011-12 and 2014-15 for each of the three identified categories of local authority identified – with the only exception being the Greater London Authority (GLA) in 2014-15.
- This trend was reversed in 2015-16, when local authorities with upper-tier responsibilities, including education and social care, and the GLA both drew down from their reserves (by £0.2 and £0.5 billion respectively). Other authorities, without upper-tier responsibilities, added £0.2 billion to their stocks of reserves. In total, English local authorities drew down £0.4 billion in net terms from reserves in 2015-16.
- In 2016-17, upper-tier authorities drew down again, and by more than in 2015-16 (£1.4 billion). The GLA once again drew down from reserves (by £0.4 billion), while other authorities added further to their stock of reserves (by £0.2 billion).
- In terms of outstanding reserves, this has left the total stock in 2016-17 £4.2 billion (22.0 per cent) higher than in 2011-12. For upper-tier authorities, the stock was £1.9 billion (13.9 per cent) higher, for the GLA it was £0.3 billion (16.2 per cent) higher and for other authorities it was £2.0 billion (53.2 per cent) higher.
Local authorities with upper-tier responsibilities also set aside less to repay debt in 2016-17, whereas other authorities increased their voluntary provisions for repayment of principal.
Looking ahead, despite the £2.0 billion of additional funding for social care announced in March, we assume that local authorities’ budgets remain under pressure as the demand for both adult and children’s social care continues to rise. As authorities are under statutory obligations to balance their budgets, we assume some of these drawdowns eventually (by 2020-21) taper off to zero. This is a key assumption in our forecast and is subject to significant uncertainty, not least because recent trends have tended to contrast with local authorities’ own budget plans.
Chart E: Net addition to reserves by local authority type (England) (left) and Chart F: Stock of reserves by local authority type (England) (right)
This box was originally published in Economic and fiscal outlook – November 2017