
In our November 2015 Economic and fiscal outlook, government consumption was forecast to fall by 5.2 per cent of GDP between its peak in 2009 and 2019. This box looked at historical and international comparisons to give some context for this fall, as well as considering the possible impact on the composition of nominal GDP.
This box is based on Bank of England investment and OECD government spending data from July 2015 and October 2015 respectively.
The new Government has significantly reduced the cuts to departmental budgets that had been pencilled in by the Coalition when it left office earlier this year. But government consumption – the closest equivalent measure in the National Accounts – is still set to fall by 5.2 per cent of GDP between its peak in 2009 and 2019.
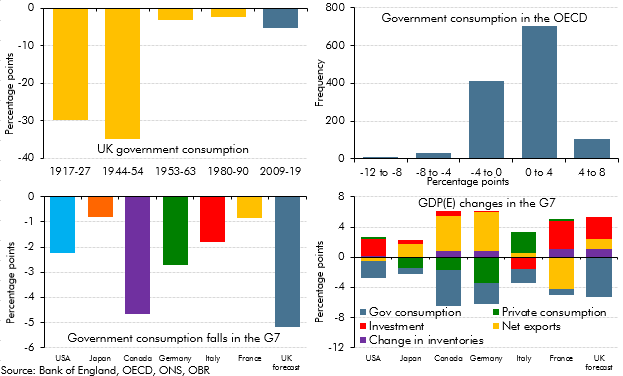
Barring the periods of demobilisation in the wake of the first and second world wars, this would be the biggest ten-year reduction in the past century (top left panel of Chart A). It would also be the biggest ten-year fall seen in any G7 country in the past half century, according to OECD data dating back to 1960. That dataset contains 38 occasions where a country has recorded falls in government consumption of more than 4 per cent of GDP over a ten-year period, which represents just 3 per cent of the total sample (top right panel).
When government consumption falls as a share of GDP, other components of nominal spending must rise by definition. For example, in the UK between 1953 and 1963 and then between 1980 and 1990, investment increased substantially as a share of GDP as government consumption was reduced. The bottom panels of Chart A show the biggest falls in government consumption in the G7 countries over this period, alongside our forecast for the UK, and the changes in other spending categories during those episodes. Of those six largest falls in government consumption, three have seen net exports provide the main offset, in two cases it was investment and in one it was private consumption. In our forecast, investment provides the largest offset.
Chart A: Historical and international comparisons of government consumptiona
This box was originally published in Economic and fiscal outlook – November 2015