
An additional rate of income tax of 50p for incomes over £150,000 was introduced in April 2010. Budget 2012 announced that this rate would be reduced to 45p from April 2013. This box explored how the incomes of those affected by this change evolved over this period - in particular the significance of forestalling and income shifting.
This box is based on HMRC income data from February 2014 .
An additional rate of income tax of 50p for incomes over £150,000 was introduced in April 2010. Budget 2012 announced that this would be reduced to 45p from April 2013 onwards.
At Budget 2012, HMRC provided an analysis of the yield from the introduction of the 50p rate, based on 2010-11 self-assessment tax returns. This concluded that the behavioural response to the increase in the additional rate had been greater than originally assumed by the previous Government. This conclusion was subject to significant uncertainty, because there was a very large forestalling effect as taxpayers brought forward incomes so that they were taxed at 40p rather than 50p. The estimated underlying yield for 2012-13 from the introduction of the 50p tax rate was also reduced from £2.6 billion to £0.6 billion.
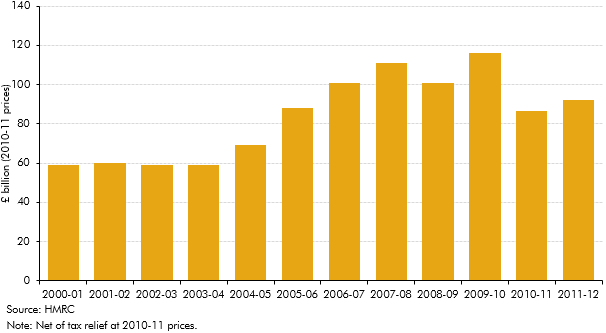
Detailed data on personal incomes and income tax liabilities are only available with a long lag. Data for 2011-12 were published in January and April 2014. These indicate that total incomes for individuals with net incomes greater than £150,000 rose from £86 billion in 2010-11 to £94 billion in 2011-12. A lot of this rise is likely to be because 2010-11 incomes were depressed by the unwinding of the forestalling that took place in 2009-10 ahead of the 50p rate being introduced. Chart A indicates that total incomes over £150,000 – expressed in constant prices – remained lower in 2011-12 than in any other year – apart from 2009-10 – since 2005-06.
Chart A: Total incomes for individuals with net incomes of more than £150,000
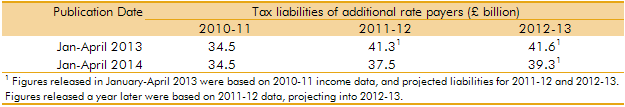
Additional rate taxpayers paid £37.5 billion in tax in 2011-12, up from £34.5 billion in 2010-11. Again, a large part of that rise is likely to reflect incomes in 2010-11 being depressed by the unwinding of the forestalling. The tax collected from this group of taxpayers in 2011-12 was less than HMRC predicted in their April 2013 projections.
Table A: Tax liabilities of additional rate taxpayers
Weaker-than-expected tax liabilities from additional rate taxpayers are not necessarily an indicator of an unexpectedly low yield from the 50p rate. Incomes for those earning above £150,000 could be depressed for other reasons. For example, high income earners are more likely to derive a higher proportion of income from savings, dividends and other investments – and these have been much weaker in recent years than employment income. In addition, the financial sector, which contains a relatively large proportion of high income earners, has struggled. To calculate the effect of the 50p rate requires a counterfactual, i.e. what would have happened in the absence of its introduction. That will always be very difficult to estimate because the 50p rate was pre-announced, leading to substantial forestalling. The latest data do not provide strong evidence to change the judgements made at Budget 2012.
It is too early to provide a meaningful reassessment of the costing of the reduction in the additional rate to 45p. Once again, because it was pre-announced, its biggest immediate effect was to prompt large amounts of income shifting by higher earners. Substantial amounts of PAYE liabilities were deferred from the end of 2012-13 into the early part of 2013-14 in order to be taxed at 45p rather than 50p. We estimate that around £1.7 billion of tax was deferred from 2012-13. With the one-year payment lag for self-assessment income tax, SA receipts were weak at the end of 2013-14. We expect them to be boosted in January 2015 when the balancing payment on 2013-14 liabilities is made.